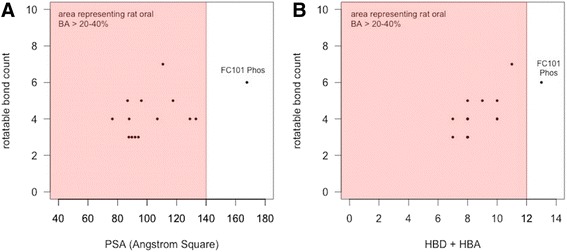
Fig. 7.

Selective criteria for drugs with rat oral BA > 20-40 %. a Scatter plot, rotatable bonds vs PSA, of FC101a hits. Each optimized hit is within the range of drugs demonstrating oral BA > 20-40 % in rat models- indicated by the shaded region. b Scatter plot, rotatable bonds VS HBD + HBA count. Regions shaded red indicate oral rat BA > 20-40 %. FC101 Phos is the only SA outside of shaded region
