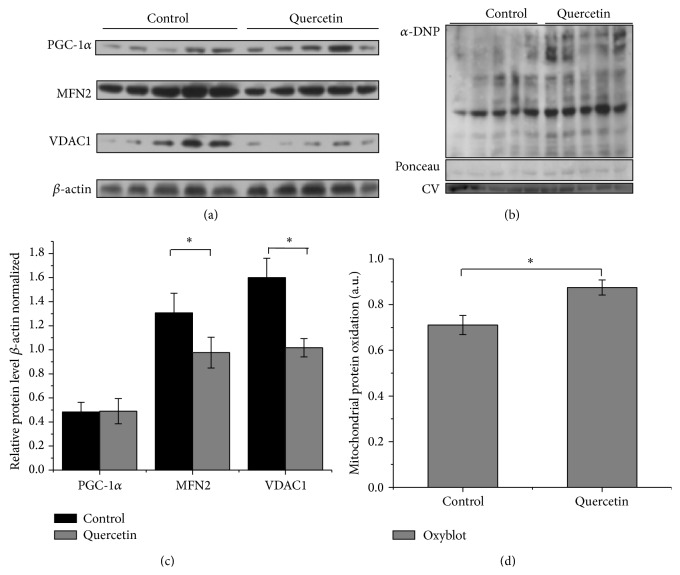
Figure 5.
Effect of quercetin treatment on the expression of PGC-1α, Mitofusin 2, VDAC, and protein oxidation. (a) Detection of carbonyl groups was performed with the OxyBlot Protein Oxidation Detection Kit. (c) Densitometry quantification of carbonyl groups was made with the ImageJ software. Carbonylation of proteins was normalized by Ponceau staining and Complex V (CV) expression. (b) Expression of mitochondrial proteins. Protein expression of MFN2, PGC-1α, and VDAC1 was analyzed in heart isolated mitochondria from control and quercetin-treated mice. β-actin was used as a loading control. (d) Densitometry analysis. MFN2, PGC-1α, and VDAC1 expressions were normalized by β-actin expression. Each bar represents the mean ± SD, analyzed by two-sample t-test (P < 0.05). Control mice, n = 11; quercetin-treated mice, n = 9. Each bar represents the mean ± SD, analyzed by two-sample t-test (P < 0.05). Significant differences (∗) were found between control and quercetin-treated mice. P < 0.05.

