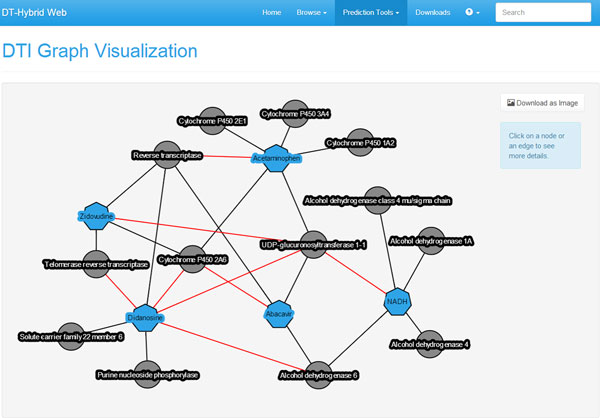
Figure 3.

DT-Web DTI network view. A DTI network after applying our prediction pipeline. Each node represents a drug (blue heptagon) or a target (gray circle), while each edge represents a drug-target interaction (user-provided ones in black, predictions in red).
