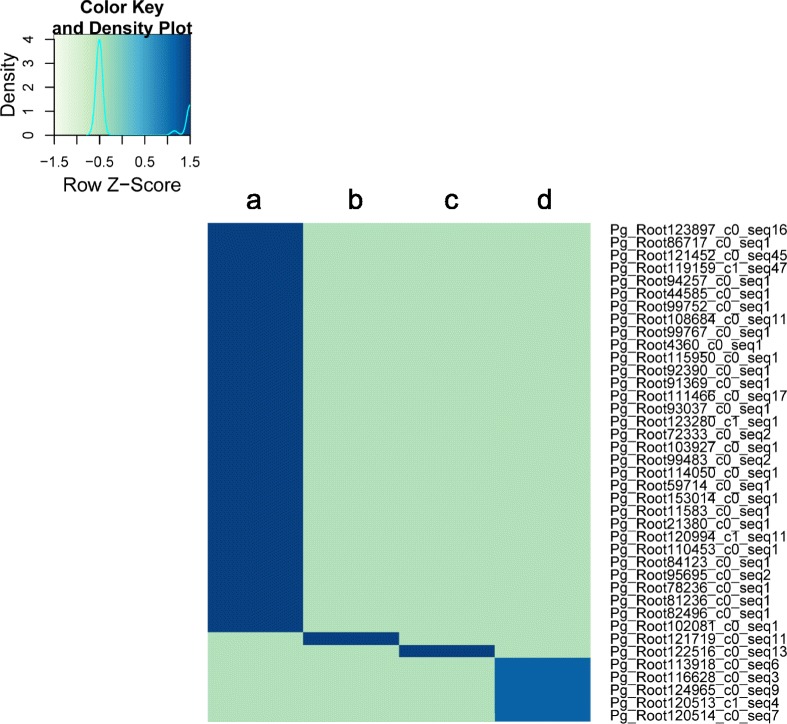
Fig. 4.

Expression profiles of specifically expressed transcripts in each of four root samples. A total of 39 transcripts were found to be specifically expressed based on the criteria of FPKM value > 3 in one sample and <1 FPKM in the other samples. Heatmap shows the hierarchical clustering of average FPKM values obtained from individual FPKM values of three replicates. a indicates one-year-old whole roots, and b, c, and d represent main bodies, lateral roots, and rhizomes of six-year-old root samples, respectively. Transcript IDs are shown to the right of the heatmap
