Fig. 1.
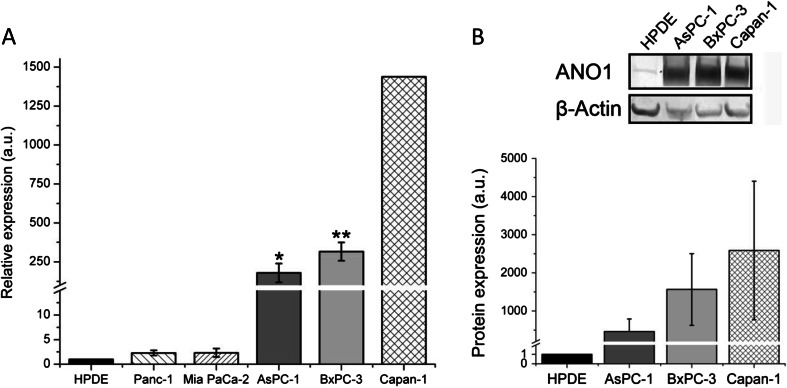
ANO1 is upregulated at the mRNA and protein levels in all PDAC cell lines tested. a Mean ANO1 expressions measured by RT-qPCR in five PDAC cell lines (Panc-1, Mia PaCa-2, BxPC-3, AsPC-1, and Capan-1) compared to the immortalized human pancreatic ductal cell line (HPDE). Data for Capan-1 was taken from [45] and recalculated relative to the value in the HPDE cell line. b Western blot analysis in three pancreatic cancer cell lines and HPDE with β-actin as a loading control. Mean ± s.e.m. of n = 4–5 individual experiments

