
Fig. 8.
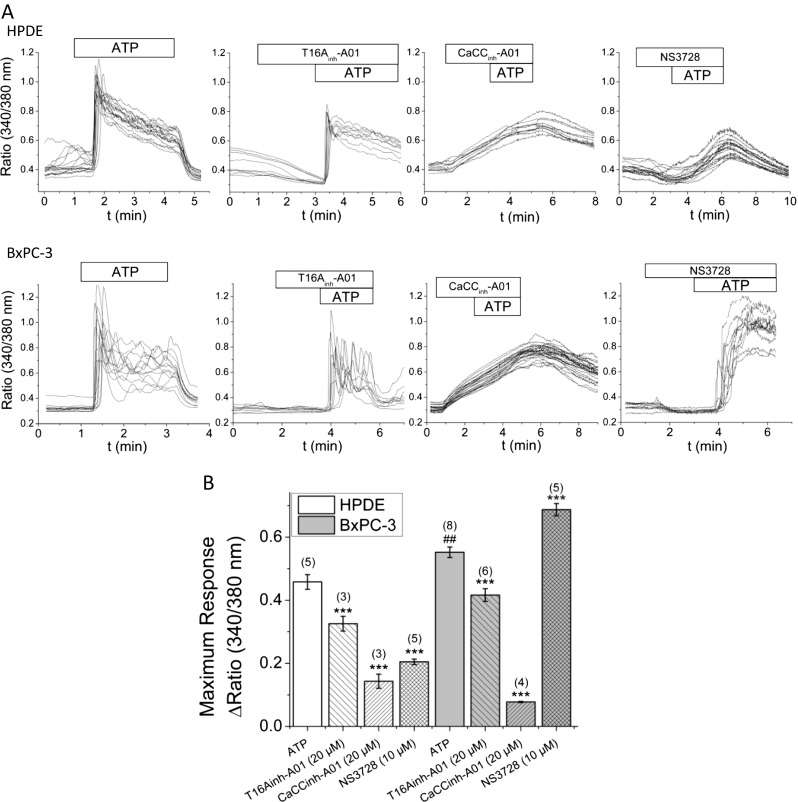
Cl− channel inhibitors alter ATP-induced Ca2+ signals. Intracellular Ca2+ measurements in FURA-2 loaded HPDE and BxPC-3 cells. a Representative single-cell traces of individual experiments. Different substances were applied as indicated. ATP was applied at 10 μM, T16Ainh-A01 and CaCCinh-A01 at 20 μM, and NS3728 at 10 μM. b Summary of maximum ATP-induced changes in [Ca2+]i; for CaCCinh-A01, these values may be overestimates as the peak response was not present. (n) = number of individual experiments; each containing between 5–45 single cells.***p ≤ 0.001 when compared to no inhibitor condition; ## p ≤ 0.01 when compared with HPDE no inhibitor