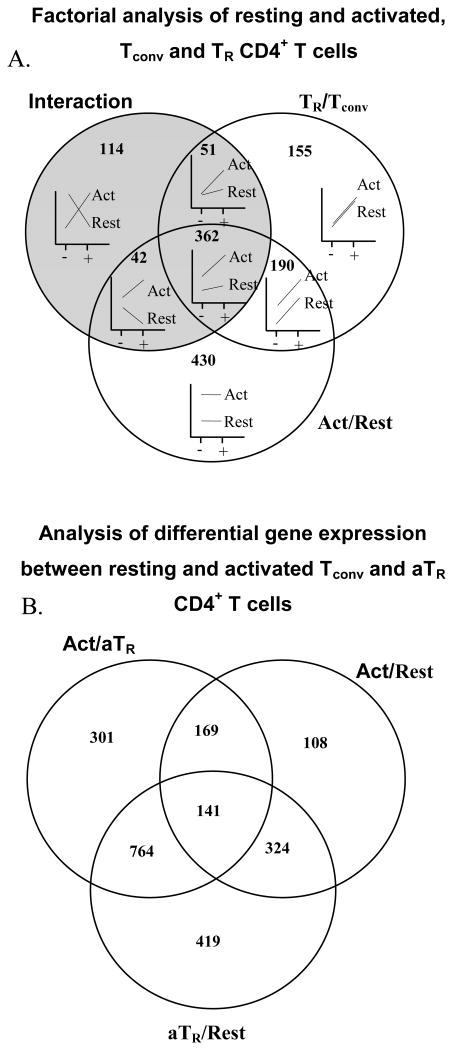
Figure 1.
Transcriptional profile of resting and activated conventional (Tconv) and TR CD4+ T cells. (A) Venn diagram of genes differentially-expressed in activated vs. resting cells and TR vs. Tconv cells. Shaded circle includes genes showing interaction effect suggesting that expression of genes in Tconv and TR cells depends on activation status and cell type. Plots inside Venn diagram show examples of possible gene expression profiles in each section of the diagram. “+” denotes Foxp3GFP+ (TR cells), “-” denotes Foxp3GFP- (Tconv cells), “Act” denotes activated and “Rest” denotes resting T cells. (B) Venn diagram of genes differentially-expressed in adaptive aTR and resting and activated Tconv cells. Right upper circle = genes differentially-expressed between activated and resting Tconv cells; lower circle = genes differentially-expressed between aTR and resting Tconv cells; left upper circle = genes differentially-expressed between activated Tconv and aTR cells.

