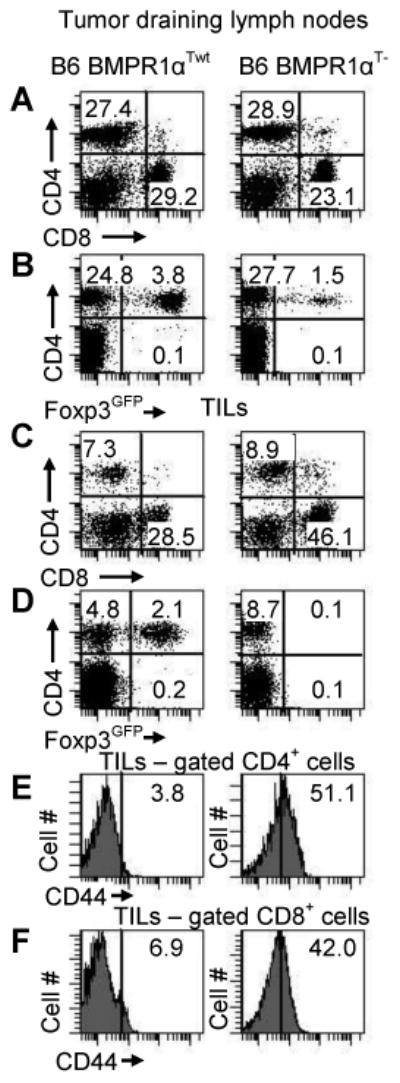
Figure 8.

T-Cell populations. T-cell levels in (A-D) tumor draining lymph nodes and (E, F) tumors of tumor-bearing BMPR1αTwt (left column) and BMPR1αT- (right column) mice. (A) CD4 and CD8 T-cell populations in tumor draining lymph nodes. (B) Foxp3 expression on CD4+ T-cells in tumor draining lymph nodes. (C) CD4 and CD8 T-cell populations in tumor-infiltrating cells. (D) Foxp3 expression on CD4+ T-cells in tumors. (E, F) CD44 expression on gated CD4+ and CD8+ T-cells in tumors. The plot shows a representative experiment (of three).
