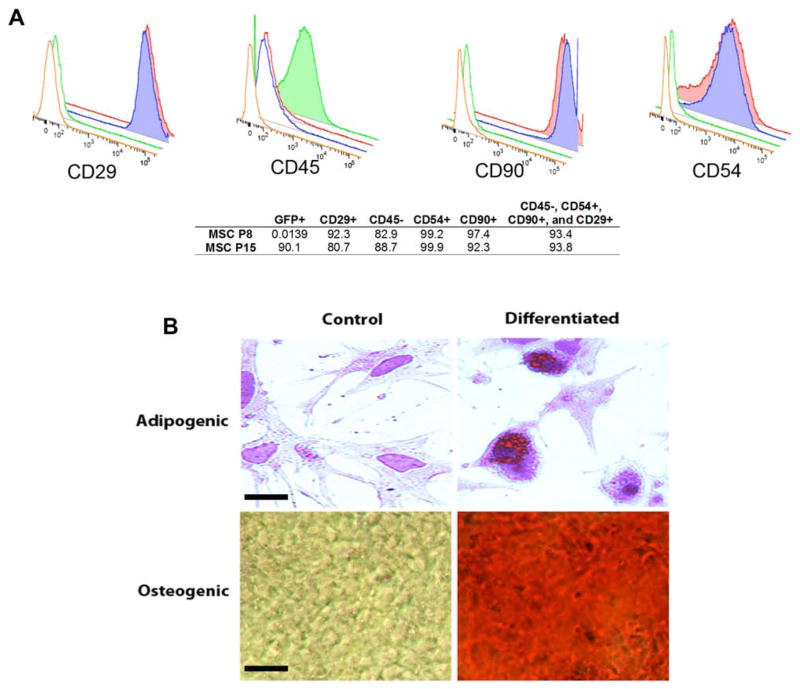
Figure 1.
Characterization of mesenchymal stem cells (MSCs). (A) Example flow cytometry results showing positivity for cluster of differentiation 29 (CD29), CD90, and CD54, as well as negativity for CD45. Blue represents MSCs at P8, 0.0139% of which were green fluorescent protein positive (GFP+), since this was prior to GFP labeling. Red represents MSCs at P15, 90.1% of which were GFP+, after GFP labeling. Green and orange are negative controls; 93.8% of P15 cells were CD29+, CD90+, CD54+, and CD45−. (B) Adipogenic and osteogenic differentiation of MSCs. Adipogenic-induced cells contained intracellular lipid droplets, stained orange by oil red O (scale bar: 10 μm). Osteogenic-induced cells are red as assessed with alizarin red staining (scale bar: 100 μm).

