Figure 2.
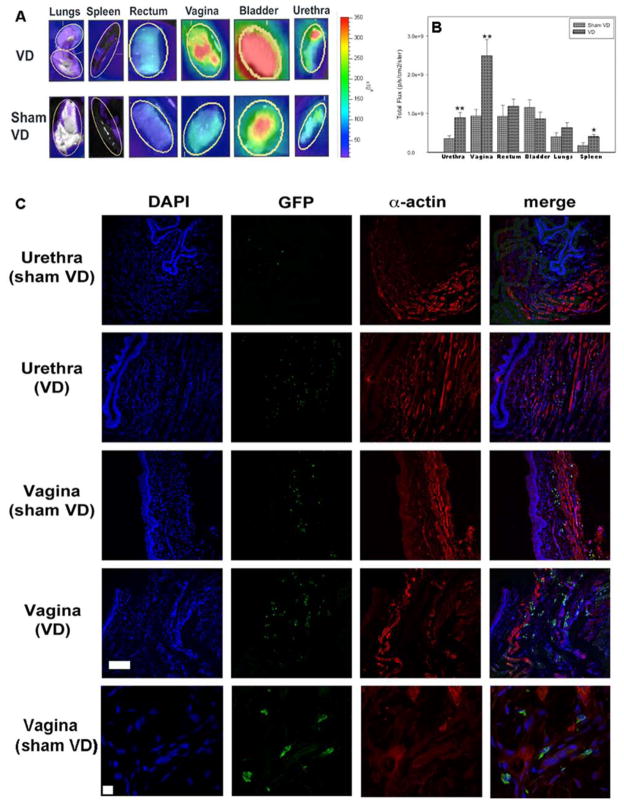
Homing of mesenchymal stem cells (MSCs) to pelvic organs 1 week after vaginal distension (VD) and sham VD. (A) Example ex vivo whole organ imaging results. Yellow oval indicates region of interest inside of which fluorescent flux was calculated. Pseudocolor scale indicates the quantification of level of fluorescent flux, with red being the most intense and purple being the least intense. Rats that received no cells had only nominal total fluorescent flux and are not shown. (B) Fluorescent flux of organs 1 week after VD or sham VD. Each bar indicates mean ± standard error of the mean of organs from nine rats. *A statistically significant difference compared to the same organ from the sham VD group with p < 0.05. **A statistically significant difference compared to the same organ from the sham VD group with p < 0.005. (C) Example immunofluorescence from the urethra and vagina 1 week after VD or sham VD. Blue indicates nuclei with 4′,6-diamidino-2-phenylindole (DAPI) stain; green indicates MSCs labeled with green fluorescent protein (GFP); red indicates smooth muscle with α-actin immunolabeling. Rows 1–4 are at the same magnification (scale bar: 100 μm). The last row shows an example immunofluorescence at higher magnification (scale bar: 10 μm) demonstrating dual labeling of blue and green to show association of nuclei with MSCs. Rats that did not receive cells did not show fluorescence (data not shown).

