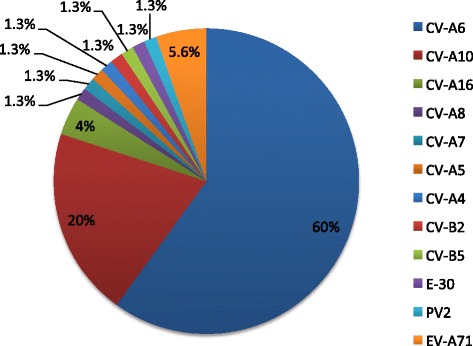
Fig. 3.

Pie chart showing the frequency of specific EV serotypes detected by nested RT-PCR followed by sequencing of amplified products; CV-A6 (n = 45), CV-A 10 (15), CV-A 16 (3), EV-A71 (4), CV-A 8 (1), CV-A 7 (1), CV-A 5 (1), CV-A 4 (1), CV-B2 (1), CV-B5 (1), E-30 (1), PV2 [vaccine strain] (1)
