Figure 1.

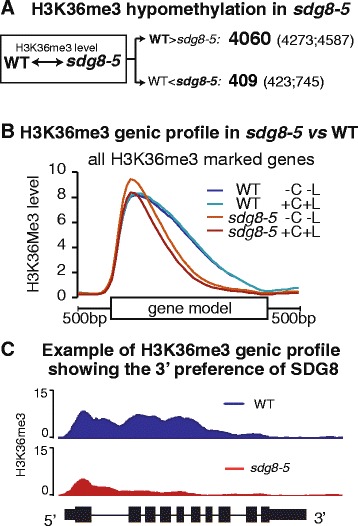
Altered global H3K36me3 profiles in sdg8-5, a complete deletion mutant of the histone methyltransferase SDG8. (A) The number of genes with differential H3K36me3 levels between the sdg8-5 mutant and WT is listed. The major effect of the SDG8 deletion is the loss of H3K36me3 in 4,060 genes in the sdg8-5 mutant. The numbers in parenthesis represent the number of differentially marked genes without or with a transient 2 h carbon and light treatment, while the number in bold is the common set between the two conditions. (B) The positional distribution of H3K36me3 on genic features was plotted and compared between sdg8-5 and WT: for each gene with a significant H3K36me3 level, the gene model (based on phytozome annotation V7 of Arabidopsis genome TAIR10 (October 2011)) was divided into 40 bins, and 500 bp upstream and 500 bp downstream sequences were split into 10 bins each. The H3K36me3 level of each bin was calculated as the mean single nucleotide coverage from the ChIP library (calculated using BEDTools and RPM (Reads Per Million) normalized). The median H3K36me3 across all significantly marked genes is plotted (Enrichment level ChIP/Input >2, FDR <0.01, approximately 12,000 genes in WT and approximately 9,000 genes in sdg8-5). Since the deletion of SDG8 in sdg8-5 causes a dramatic drop in the number of genes with H3K36me3 marks, the H3K36me3 level was further normalized to correct for the difference in genome coverage between WT and the sdg8-5 mutant for the plot. Upon the deletion of SDG8, we observed a loss of H3K36me3 marks preferentially towards the 3′ of the gene model (B). (C) A gene example AT4G11960 where the H3K36me3 mark located towards the 3′ of the gene-coding region is lost in the sdg8-5 mutant. Y-axis is the RPM normalized ChIP read counts of H3K36me3.
