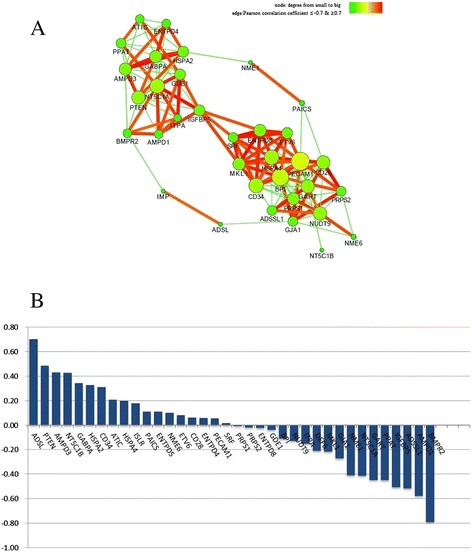
Fig. 3.

a Regulating relation among 19 IMP genes, 15 CGs and IMP content with Pearson correlation coefficient ≥0.7 was visualized by Network Analyzer plugin of Cytoscape. b The histogram depicted the relationships between IMP content and 34 genes and was drawn via Microsoft Excel 2010
