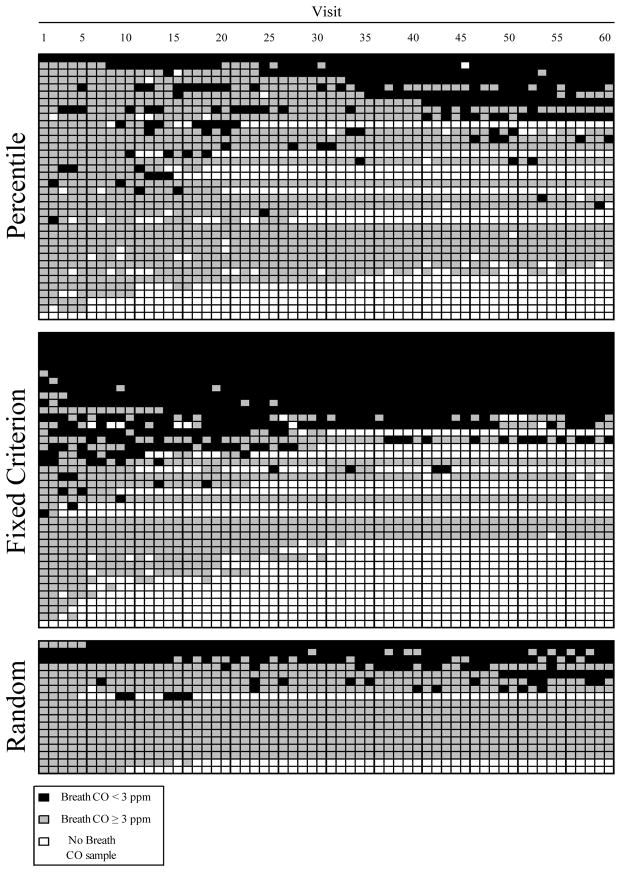
Figure 1.
Event records for percentile, fixed criterion and random incentive participants. An individual participant constitutes one row on the ordinate. Visit number is shown on the abscissa. Black areas represent visits with breath CO samples < 3 ppm. Gray areas represent visits with breath CO samples ≥ 3 ppm. White areas represent missed visits.

