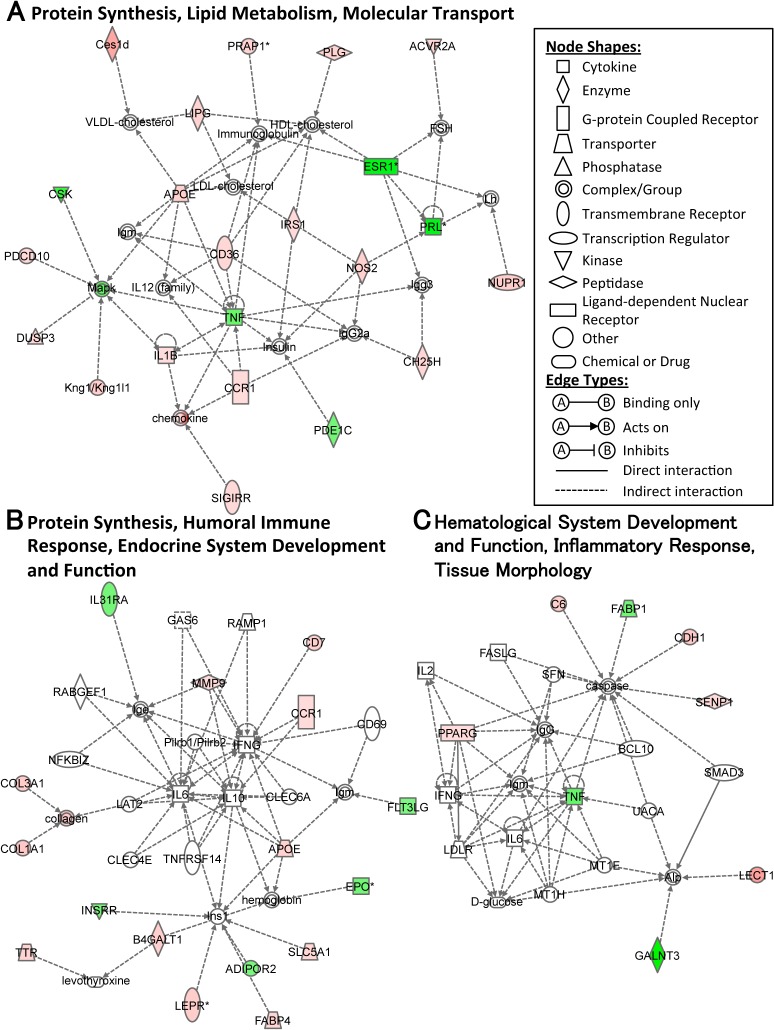
Fig 5. The top three gene-networks in response to mild exercise.
Network analyses of the genes whose expression was modified with ME vs CONT are shown. Major functions of the networks are indicated in 1st (A), 2nd (B) and 3rd (C) network. The score is the negative log of the p value and signifies the possibility of network-eligible genes within a network being clustered together as a result of chance. The biological relationship between two genes is represented as an edge (line), which is supported by at least one reference from the literature or a textbook. The intensity of the node color indicates the degree of up- (red) or down- (green) regulation. Nodes are displayed using various shapes that represent the functional class of the gene product.

