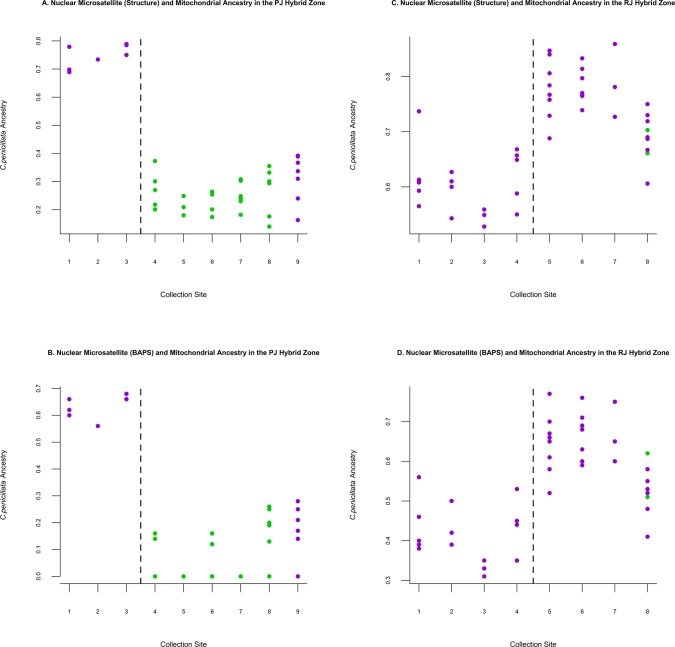
Fig 6. Combined results from microsatellite cluster analysis and mtDNA data from Malukiewicz et al. [23].
Panels A-D are separated by the PJ natural hybrid zone/RJ anthropogenic hybrid zone and STRUCTURE/ BAPS microsatellite q-values and coupled with mtDNA haplotypes from Malukiewicz et al. [23]. The x-axis shows individual PJ and RJ collection sites, which are numbered the same as in Figs 2 and 3. The y-axis indicates the level of C. penicillata ancestry. The dashed lines indicate a south/north hybrid zone divide in each figure panel. Purple indicates C. penicillata mtDNA haplotypes and green indicates C. jacchus mtDNA haplotypes.

