
Figure 4. TE involvement in lncRNA turnover.
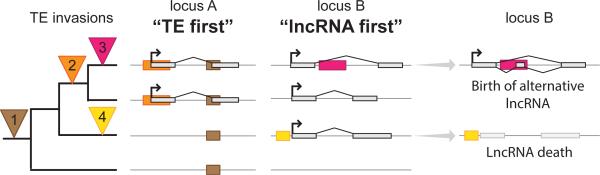
The figure represents “TE first” and “lncRNA first” models. On the left, phylogenetic relationships between four hypothetical species are represented along with four independent waves of TE invasion (filled and numbered triangles, as follow: 1; brown. 2; orange. 3; pink. 4; yellow). Filled boxes with the same colors represent a TE after insertion on the three other panels. At locus A, the “TE first” model is schematized by a transcript born after TE invasions. Orange TE provides the TSS and some TE material corresponding to a more ancient invasion (brown) could be coopted as well. At locus B, the “lncRNA first” model (the origin of the lncRNA predates TE incorporation) is schematized by transposons integrating or close to lncRNAs. This can lead to transcript alterations: birth of an alternative lncRNA that may or may not replace the originally shared lncRNA (pink), or death of the lncRNA by disruption of the cis-regulatory sequences (yellow). The two models are non-exclusive and can draw a quite complicated evolutionary picture due to the continuous turn over; for example lineage specific TEs could insert close to the lncRNA represented in locus A and alter it. LncRNA exons are represented as boxes filled in light grey, and arrow marks the TSS. Grey lines represent genomic DNA.