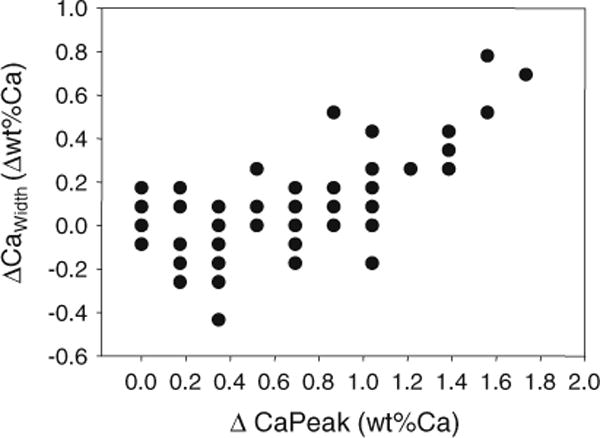
Fig. 2.

Relation of the difference in BMDD width (ΔCaWidth) obtained from the single cortical compartment and two cortical compartment method (Ct.TOT CaWidth − Ct. CaWidth) in relation to the differences of the BMDD peak position (ΔCaPeak) of the individual cortical plates C1 and C2: the plot shows that only at larger ΔCaPeak (about >1 wt% Ca) differences for CaWidth might become relevant between Ct.TOT and Ct. method. Please note that the data were obtained for the entire cohort (n = 73 samples) but many of the data points overlap due to the fact that both CaWidth and CaPeak can take only discrete values as given by the bin width of the BMDD
