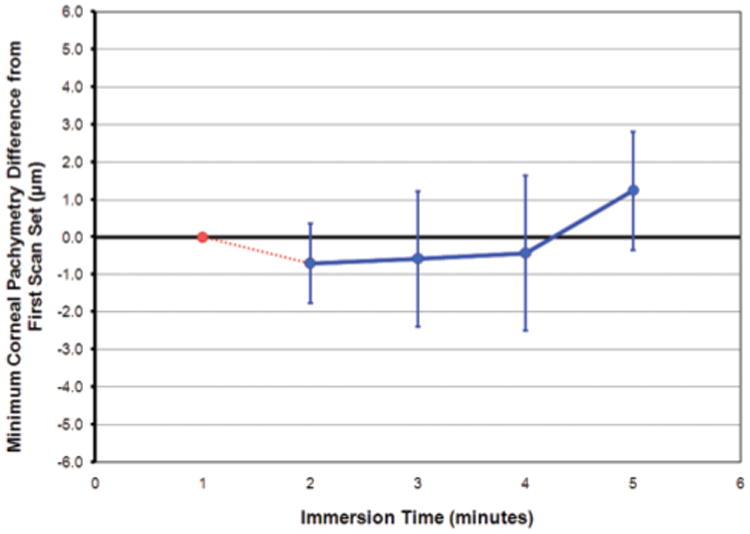
Figure 4.

Line plot showing the mean difference between the minimum corneal thickness of the first scan set and each of the four subsequent scan sets. The first scan set is shown as a reference point in red. The blue data points are the mean difference from the first scan set. The error bars represent one standard deviation for each of the subsequent scan sets.
