
Figure 3. Confocal imaging and quantification of mitochondria mass and membrane potential in magnetic nanoparticles-loaded and unloaded primary rat aortic endothelial cells.
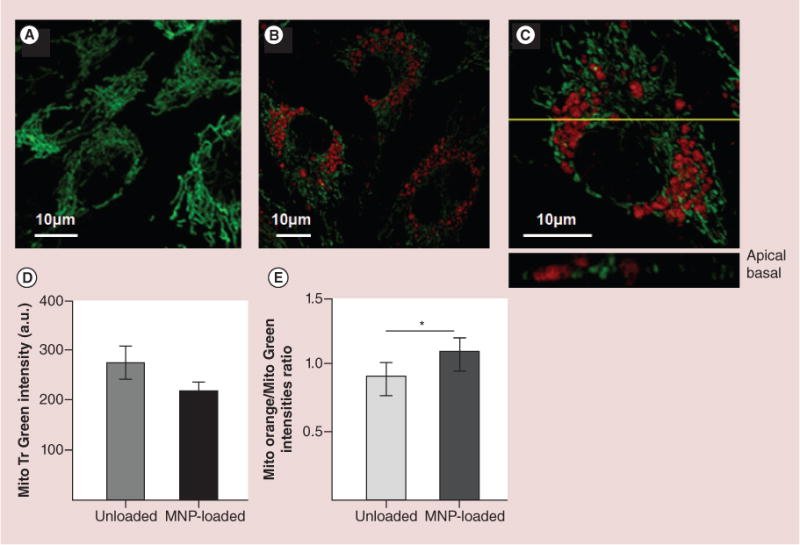
Mitochondria were labeled with membrane-insensitive dye, MitoTracker Green (70nM). BODIPY®564/570 nm-MNPs were used to discern them from mitochondria. (A) Confocal image of mitochondria in unloaded primary rat aortic endothelial cells (RAECs). (B) The image of RAECs loaded with MNPs for 24 h. (C) Magnified image of a single cell presented in image B. The yellow line depicts the optical plane demonstrating localization of MNPs among mitochondria. It is clear that nanoparticles do not co-localize with organelles but rather deflect them. (D) Flow cytometry data of mitochondria mass quantified as a mean of MitoTracker Green intensity collected from unloaded and MNP-loaded RAECs. 104 cells were accounted in each experiment. Data presented as mean ± SEM (n = 3), statistically ns. (E) Comparative quantification of the distribution of mitochondria populations with high and low membrane potential in MNPs loaded and unloaded RAECs. Cell mitochondria were double labeled with membrane potential sensitive (MitoTracker Orange) and insensitive (MitoTracker Green) dyes and analyzed flow cytometrically. Data presented as mean ± SEM (n = 3), p < 0.0001.
MNP: Magnetic nanoparticle.