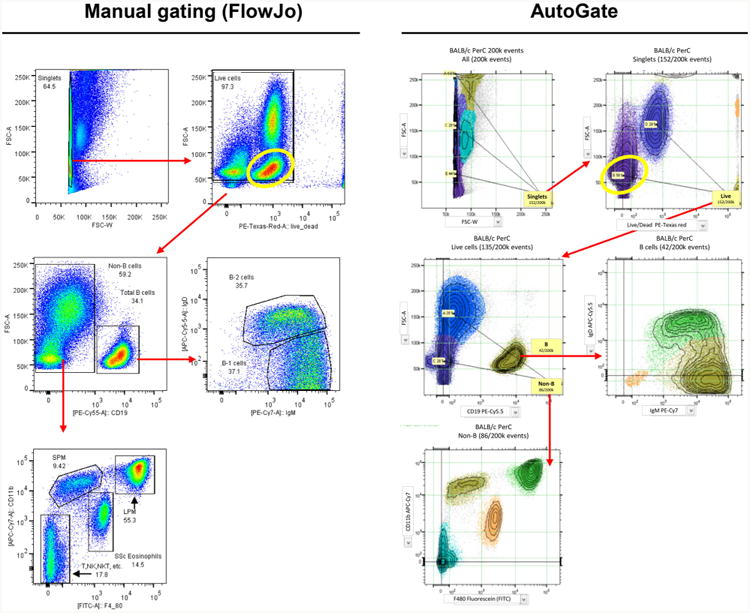
Fig. 1.

Comparison of gating using FlowJo software (manual) and AutoGate. The researcher in this example (Eliver Ghosn, Genetics Department, Stanford) initially used FlowJo to draw gates (left panel) that delineate macrophage and other subsets (clusters) revealed by FACS analysis of cells isolated from the peritoneal cavity (PerC) of unimmunized (naïve) mice [5]. At successive steps in this recursive procedure, the user locates and draws gates based on the color density plot representation of regions containing data of interest. The panel on the right shows that corresponding subsets automatically identified by AutoGate, which uses a unique color to identify the cells in distinct subsets. The yellow oval defines the location of the B cells in the sample. The X axis shows data for cells stained with a viability dye that is excluded from live cells and brightly stains dead cells (which mainly fall above 104 fluorescence units on the X axis). The position of the B cells (yellow ovals) differs between the FlowJo and AutoGate analysis because AutoGate automatically applies compensation corrections to all channels, including the B cell channel in this case. FlowJo, in contrast, allowed the user in this case to omit the compensation correction for this channel, leaving the B cells and the other cells in the sample with uncompensated signals that raised their fluorescence values to the second decade. Thus, the yellow oval and the B cells within it appear in different locations in the two plots, as do the other cells in the sample
