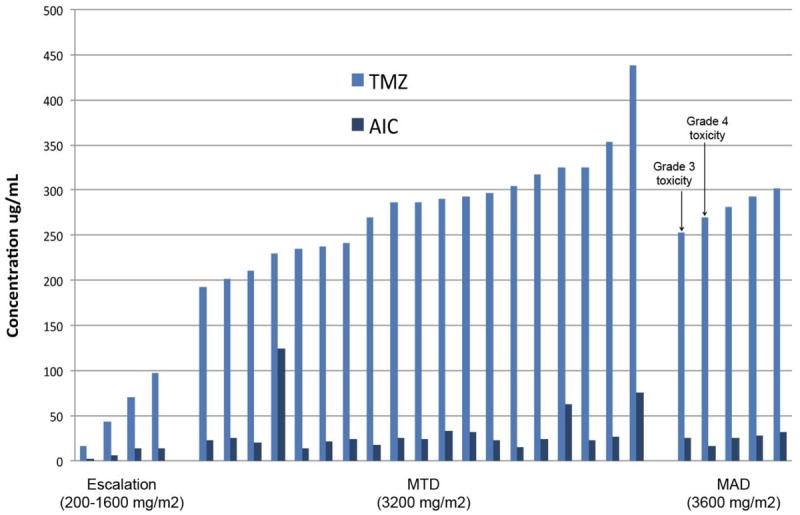
Figure 3. PK concentrations stratified by TMZ ILI dose level.

A: Peak concentrations of TMZ and AIC during ILI with TMZ by dose level. This figure should be published online only.
B: Peak concentrations of TMZ and AIC during ILI by response to treatment (n=28).
