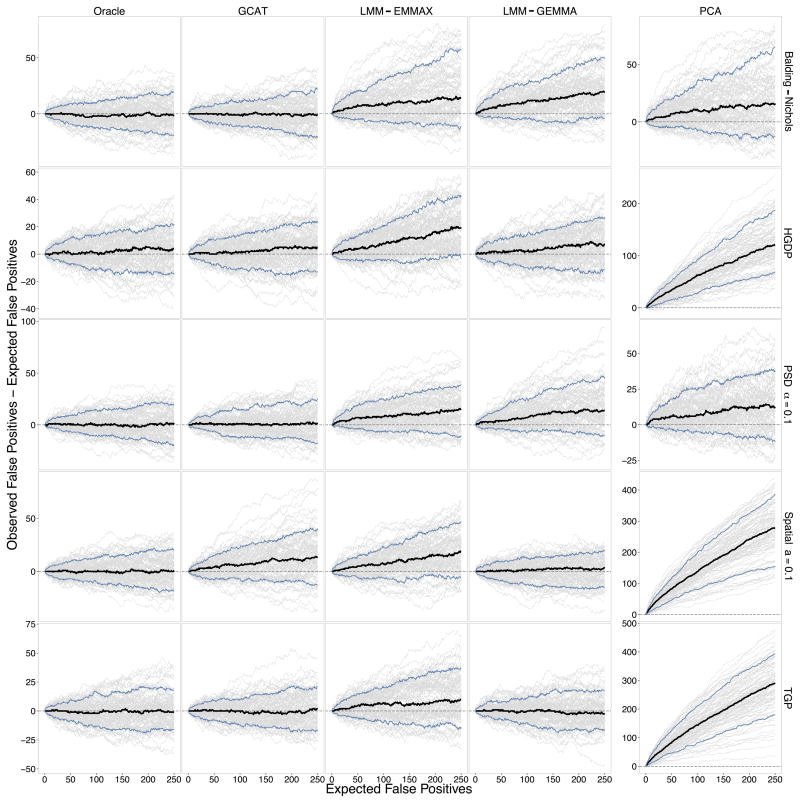
Figure 2.
Performance of association testing methods. One-hundred quantitative trait GWAS studies were simulated in each of the Balding-Nichols, HGDP, TGP, PSD (α =0.1), and Spatial (a =0.1) simulation scenarios (see Online Methods for definitions of each) to compare the Oracle, GCAT (proposed), LMM-EMMAX, LMM-GEMMA, and PCA testing methods. The variance contributions to the trait are genetic=5%, non-genetic=5%, and noise=90%. The difference between the observed number of false positives and expected number of false positives is plotted against the expected number of false positives under the null hypothesis of no association for each simulated study (grey lines), the average of those differences (black line), and the middle 90% (blue lines). All simulations involved m =100,000 SNPs, so the range of the x-axis corresponds to choosing a significance threshold of up to p-value ≤ 0.0025. The difference on the y-axis is the number of “spurious associations.” PCA is shown on a separate y-axis since it usually has a much larger maximum than the other methods. The Oracle method is where the true population structure parameters are inputted into the proposed test (see Results), which we have theoretically proven always corrects for structure (see Supplementary Note).

