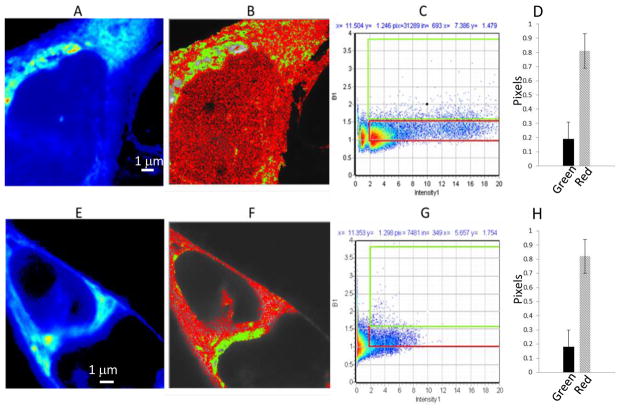
Fig. 1.
N&B analysis of JU77 cells expressing sFRP4-EGFP; (A–D) and (E–H) following Wnt3a treatment. A and E. Average intensity image of a single optical plane. B and F. Image with identification of pixels with brightness corresponding to monomers (red, B<1.5) or oligomers (green, B>1.5). C and G. Corresponding distribution of B values versus fluorescence intensity for the same cell and selection map for red (B= 1–1.5) and green (B>1.5) pixels. D and H. Fraction of pixels corresponding to oligomer (green) and monomer (red).

