Fig. 1.
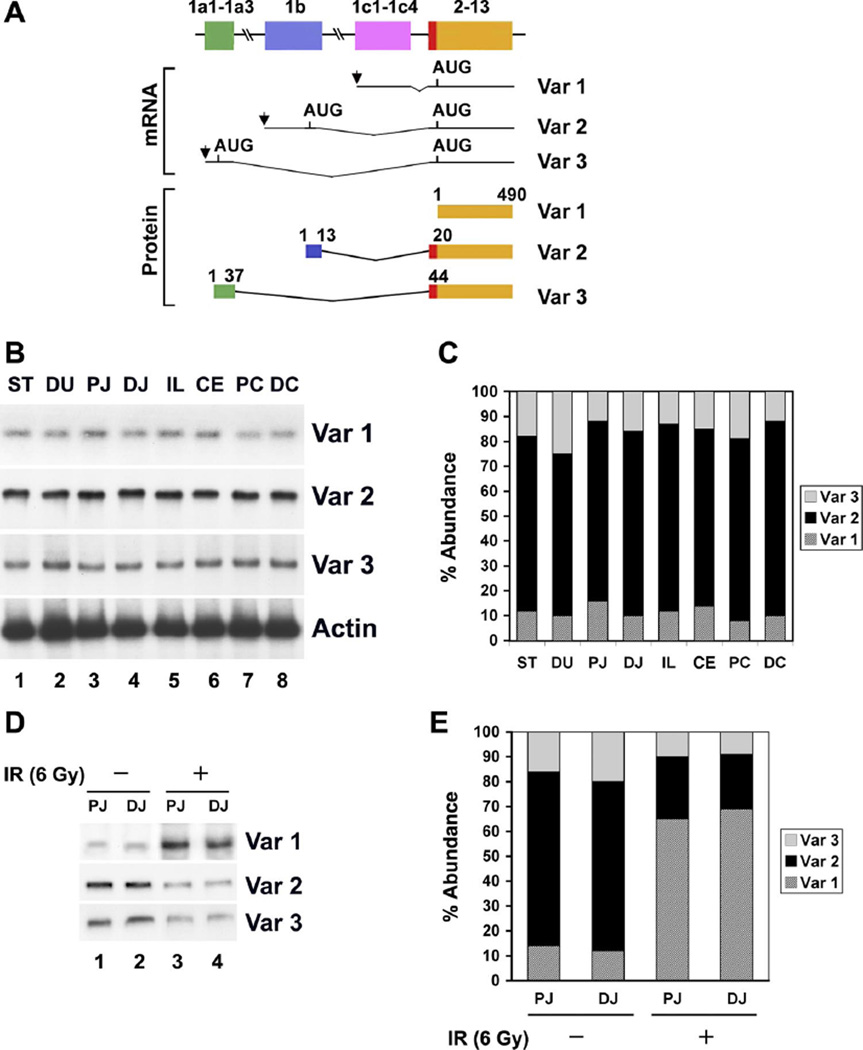
Differential expression of CUG triplet repeat-binding protein 2 (CUGBP2) variants in mouse gastrointestinal tissues. A: schematic representation of the structure of the three CUGBP2 variants (var). Alternative promoter usage of the CUGBP2 gene generated 3 transcript variants, resulting in the presence of distinct exon 1 (1a–1c). Exons are depicted by boxes and introns by horizontal lines. The arrows indicate transcription start sites, and the location of AUGs encoding CUGBP2 variants are shown. For the sake of simplicity, the four exons that are included within the coding region (exons 2–13) are grouped together. Similarly, the 5′ exons that make up variant exons 1a and 1c are shown as one exon. The CUGBP2 variant 1 is 490 amino acids long starting from the AUG in exon 2. However, variants 2 and 3 have extra NH2-terminal 19 and 43 amino acids due to the presence of an additional AUG start codon in exon 1b and 1a, respectively. B: expression of the 3 variants in mouse gastrointestinal tissues. Representative autoradiograph of a semiquantitative RT-PCR was performed in the presence of 32P-CTP using variant-specific primers. All 3 isoforms are expressed. ST, stomach; DU, duodenum; PJ, proximal jejunum; DJ, distal jejunum; IL, ileum; CE, cecum; PC, proximal colon; DC, distal colon. C: abundance of the 3 variants. Data demonstrates that var 2 transcript is the predominant isoform in normal tissues, whereas var 1 is expressed at the lowest level. Data from 5 mice. D: differential variant expression in the small intestine following γ-irradiation. Total RNA from the proximal (PJ) and distal (DJ) jejunum from mice exposed to 6 Gy γ-irradiation were subjected to semiquantitative RT-PCR. Whereas var 1 expression is significantly upregulated, both var 2 and var 3 transcripts are downregulated compared with the same tissues from unirradiated animals. E: abundance of variants following γ-irradiation. Data demonstrates the significant down-regulation of var 2 and 3 and upregulation of var 1 transcript. Data from 3 mice.

