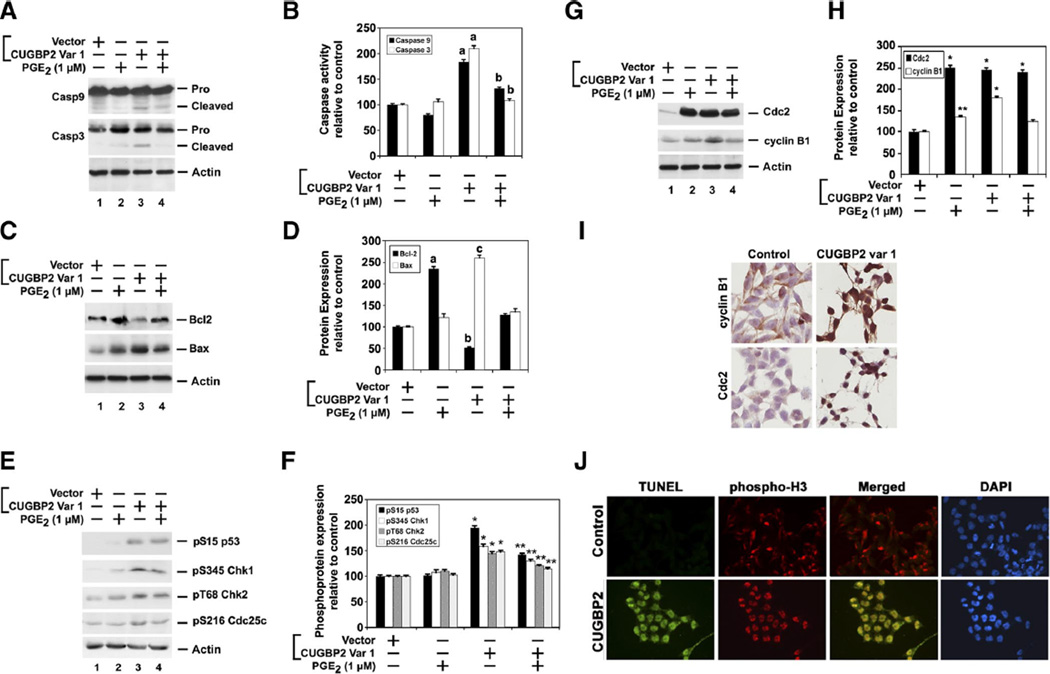
Fig. 5.
CUGBP2 variant 1 overexpression results in mitotic catastrophe. A: CUGBP2 variant 1 overexpression resulted in activation of proapoptotic caspases. Lysates from HCT116 cells transiently expressing Flag-tagged CUGBP2 variant 1 and treated with PGE2 (1 µM)were subjected to Western blot analysis for caspase-3 and caspase-9. Both caspases were activated in the presence of CUGBP2 variant 1, which was partially suppressed when cells were also incubated with PGE2. β-actin was used as internal control for loading. B: abundance of caspase activity. Chemiluminescence data from 3 independent experiments was graphed. Expression of variant 1 significantly upregulated caspase-3 and caspase-9. a, P < 0.001 compared with control. b, P < 0.001 compared with CUGBP2 var 1 alone. C: proapoptotic Bax and antiapoptotic Bcl2 protein expression were analyzed in the lysates from HCT116 cells. Flag-tagged CUGBP2 variant 1 induced Bax expression but inhibited Bcl2. D: abundance of Bcl2 and Bax proteins. Chemiluminescence levels from 3 independent experiments were compared with levels observed in control, vector transfected cells. PGE2 significantly induced, whereas CUGBP2 variant 1 inhibited expression of Bcl2. On the other hand, CUGBP2 induced expression of Bax protein. Data from 3 independent experiments. a, P < 0.001 compared with Bcl2 expression in control cells; b, P < 0.05 compared with control cells; c, P < 0.001 compared with Bax expression in control cells. E: CUGBP2 variant 1 overexpression induces checkpoint proteins. Western blot analysis of lysates from HCT116 cells expressing Flag-tagged CUGBP2 variant 1 and treated with PGE2 (1 µM) demonstrated increased phosphorylation of Chk1 and Chk2 at Ser345 and Thr68, respectively. In addition, Cdc25c and p53 were phosphorylated at Ser216 and Ser15, respectively. F: levels of phosphorylated protein expression. Data from 3 independent experiments were plotted comparing the expression to that observed in control, vector transfected cells. *P <0.05 compared with control, vector transfected cells, and **P < 0.05 compared with CUGBP2 variant 1 alone. G: CUGBP2 variant 1 increases cyclin B1 and Cdc2 expression. Western blot analysis demonstrates increased levels of cyclin B1 and Cdc2 in cells expressing CUGBP2 variant 1. Cdc2 was also significantly upregulated in cells treated with PGE2. H: levels of Cdc2 and cyclin B1 protein. Chemiluminescence data from 3 independent experiments demonstrates that both proteins are upregulated following expression of CUGBP2 variant 1 or treatment with PGE2 *P < 0.001, **P < 0.05, both compared with control, vector transfected cells. I: CUGBP2 variant induces the nuclear localization of cyclin B1 and Cdc2. Although cyclin B1 and Cdc2 are in the cytoplasm of control cells, there are increased levels of both proteins in the nucleus of variant 1-expressing cells. J: CUGBP2 overexpression leads to mitotic catastrophe. HCT116 cells transiently transfected with plasmid-expressing Flag-tagged CUGBP2 variant 1 were stained for TUNEL (green) and phosphorylated histone H3 (red). The merged image shows cells were yellow stain positive for colocalization. DAPI is used to stain the nucleus.

