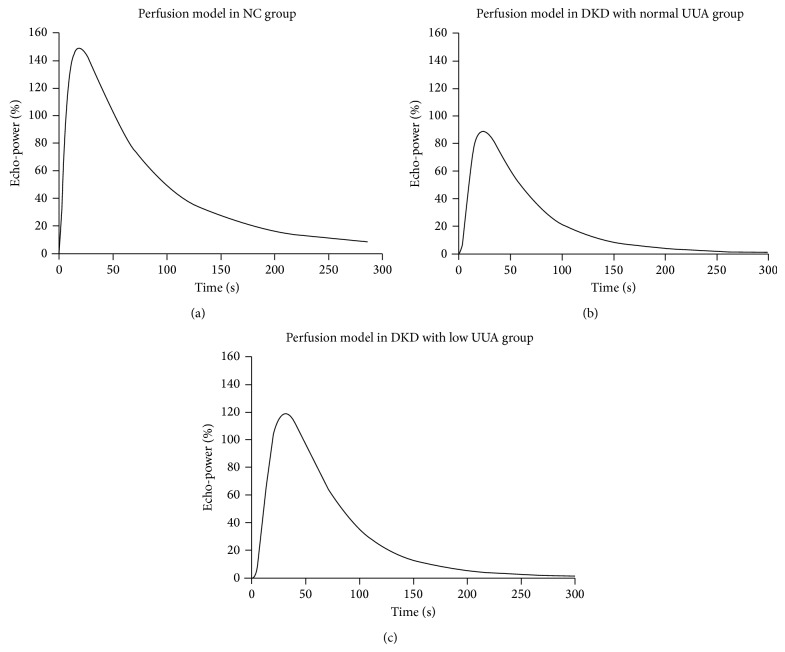
Figure 5.
Representative CEUS perfusion curves corresponding to the echo-power signal over the time-course of perfusion. NC, normal control; UUA, normal urinary uric acid; DKD, diabetic kidney disease. The curves showed that NC group exhibited the largest curve among the three groups, and low UUA DKD group had a larger perfusion curve than the normal UUA DKD group.

