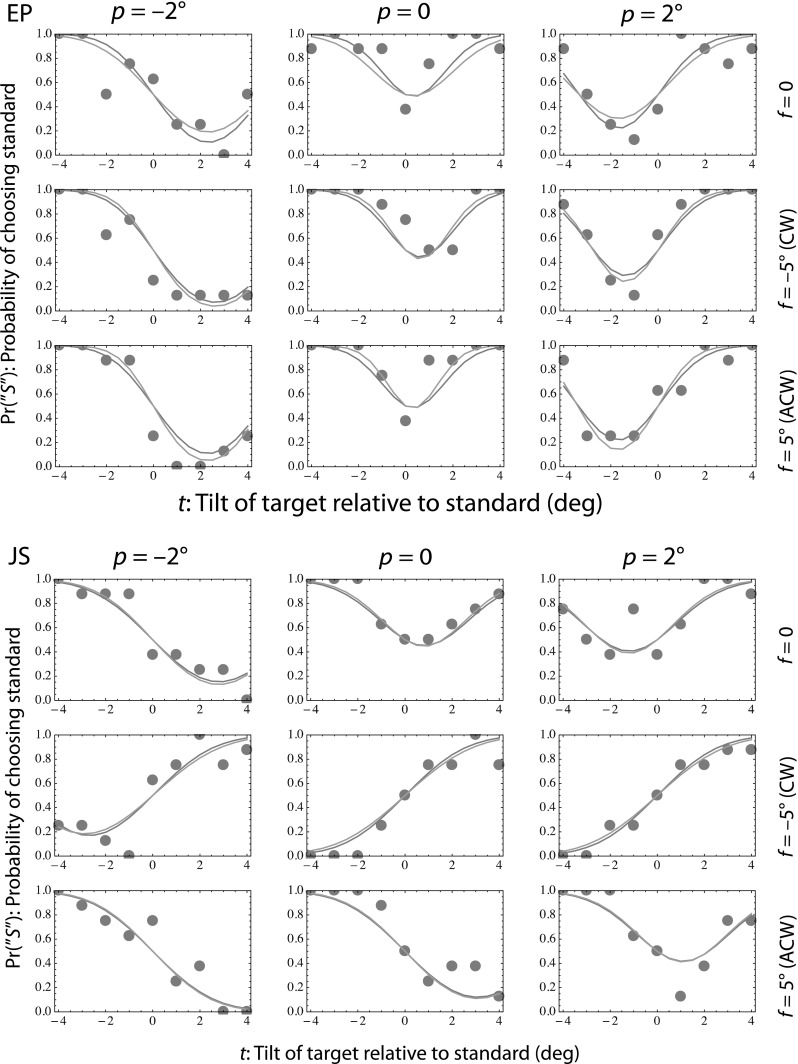
Fig. 3.

Figure shows individual psychometric functions of the perceptual test for two participants, one (JS, bottom) showing an effect of the frame and the other (EP, top) not. Each of the small panels shows the probability (vertical axis) of choosing the standard (having only the pedestal tilt) as being closer to the vertical, as a function of the tilt of the target relative to the standard (horizontal axis). In each row, the columns show results for different pedestal tilts and the rows show results for different frame tilts. The orange curves are six-parameter fits, in which the perceptual bias (μ and precision (1/1σ.σ)) was allowed to vary with each frame tilt. The blue curves (often overlapping the orange) are four-parameter fits, in which only bias (but not precision) was allowed to vary with each frame tilt. For further explanation, see text (color figure online)
