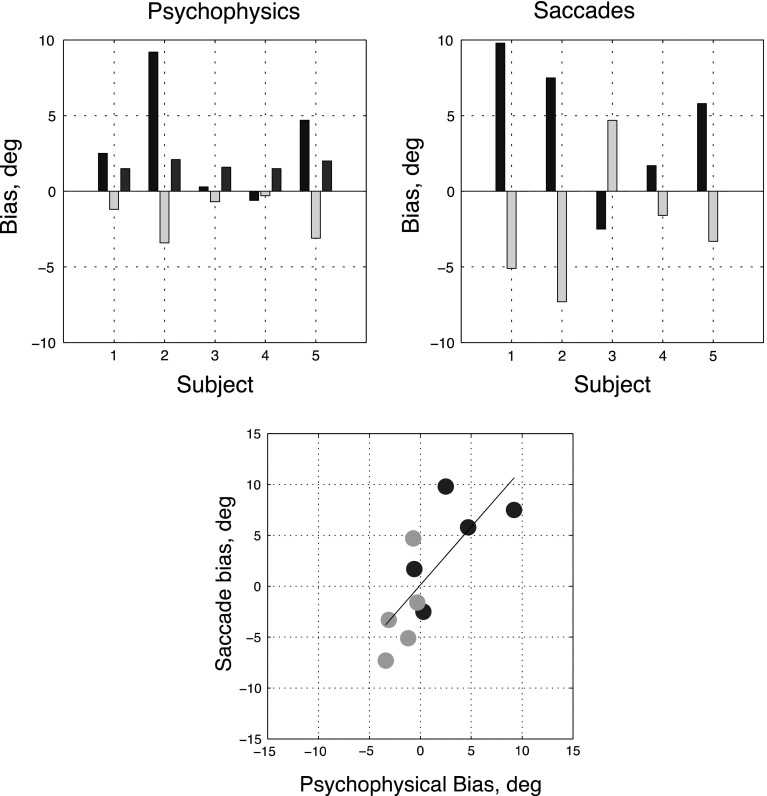
Fig. 4.
Relationship between individual subject biases in the perceptual and saccade-to-vertical tasks. The top left panel shows the effects of clockwise (green bars) and anti-clockwise (blue bars) frames upon the perception of gravitational vertical, inferred from the mean perceptual biases. Also shown are the standard deviations of the psychometric functions obtained by combining all frames (brown bars). The top right panel shows median saccadic endpoint displacement from the vertical using the same convention. The bottom panel plots the saccadic biases (vertical axis) against the psychophysical ones (horizontal axis) and the regression line through the data. The correlation between perceptual and saccade bias is 0.78 (p = .008). In order, the participants are MM, SG, DM, EP and JS (color figure online)

