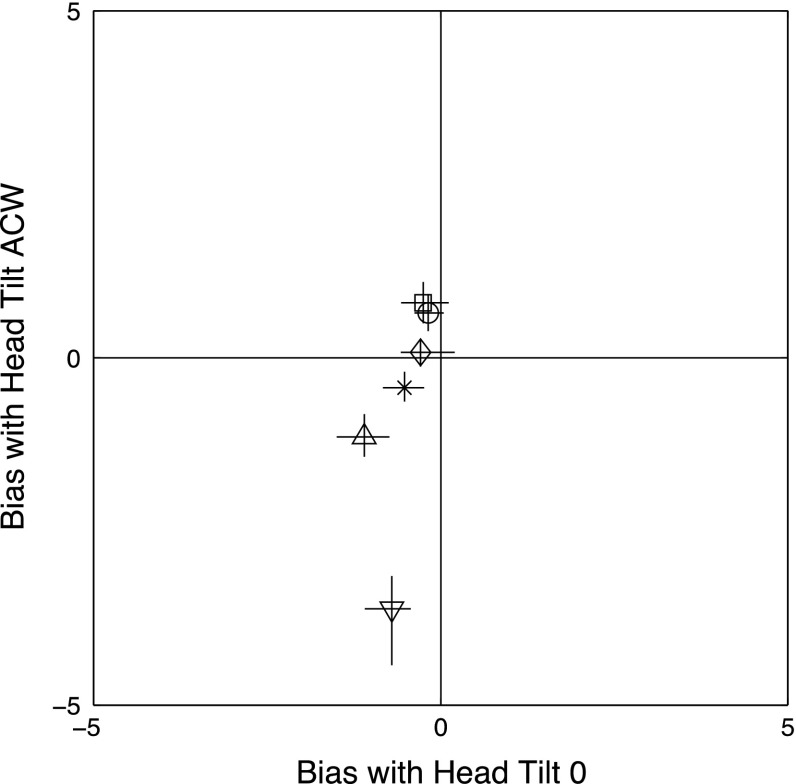
Fig. 6.
Each symbol in the figure shows bias in the perception of vertical (i.e., −μ) for one participant in the untilted head condition and with head-tilted ACW. All data were collected with an untilted frame. The symbols for the five participants identified in Fig. 4 are, in order: circle, square, x, diamond, downward pointing triangle. To this are added the results for a sixth participant, identified by an upward-pointing triangle. The error bars show 95% confidence intervals, calculated by fitting nonparametric bootstrap samples (n = 160) with the approximate formula of Morgan et al. (2013). Sufficient computing power was not available for fitting these samples with the exact formula

