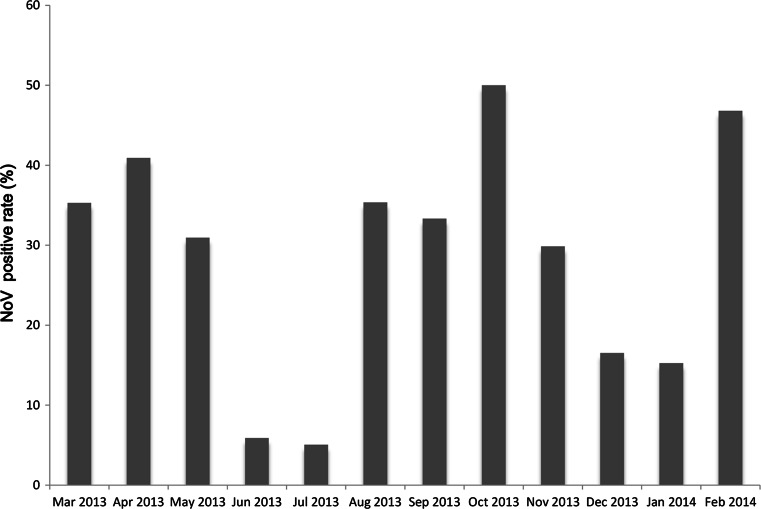
Fig. 1.
Monthly distribution of norovirus infections from March 2013 to February 2014. The highest detection rate (50.0 %) was observed in October 2013, and the lowest (5.1 %) in July 2013 (Mar, 35.3 %; Apr, 40.9 %; May, 30.9 %; Jun, 5.8 %; Jul, 5.1 %; Aug, 35.3 %; Sep, 33.3 %; Oct, 50.0 %; Nov, 29.8 %; Dec, 16.5 %; Jan, 15.2 %; Feb, 26.5 %)

