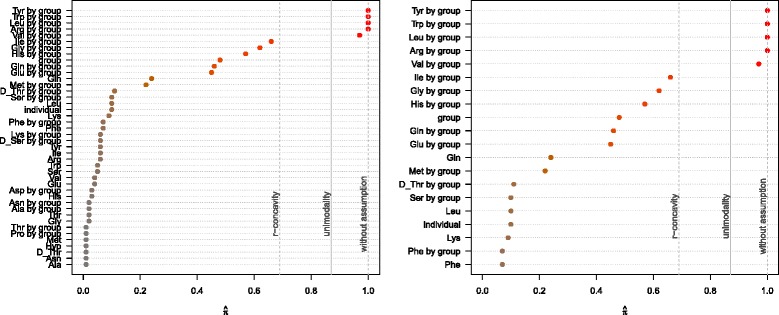
Figure 15.

Maximum selection frequency. The maximum selection frequency for all (selected) base-learners (left) and for the top 20 base-learners (right) as determined by stability selection. The solid vertical gray lines depict the threshold value with unimodality assumption (π thr=0.87), the dashed gray lines represent the threshold values with r-concavity assumption (π thr=0.69) and without assumption (π thr=1).
