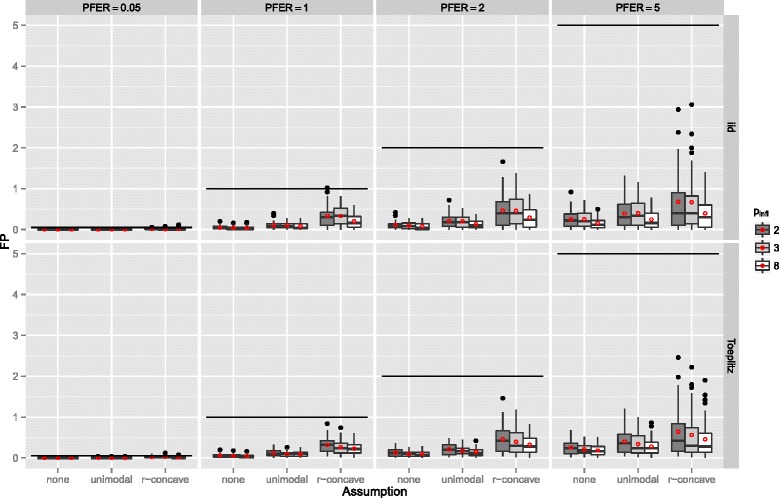
Figure 8.

Number of false positives by the number of influential variables p infl – Linear logistic regression model. Boxplots for the number of false positives (FP) for all simulation settings with separate boxplots for different numbers of influential variables (p infl), the correlation settings (independent predictor variables or Toeplitz design), the P F E R, and the assumptions used to compute the error bound. Each observation in the boxplot is the average of the 50 simulation replicates. The open red circles represent the average number of false positives.
