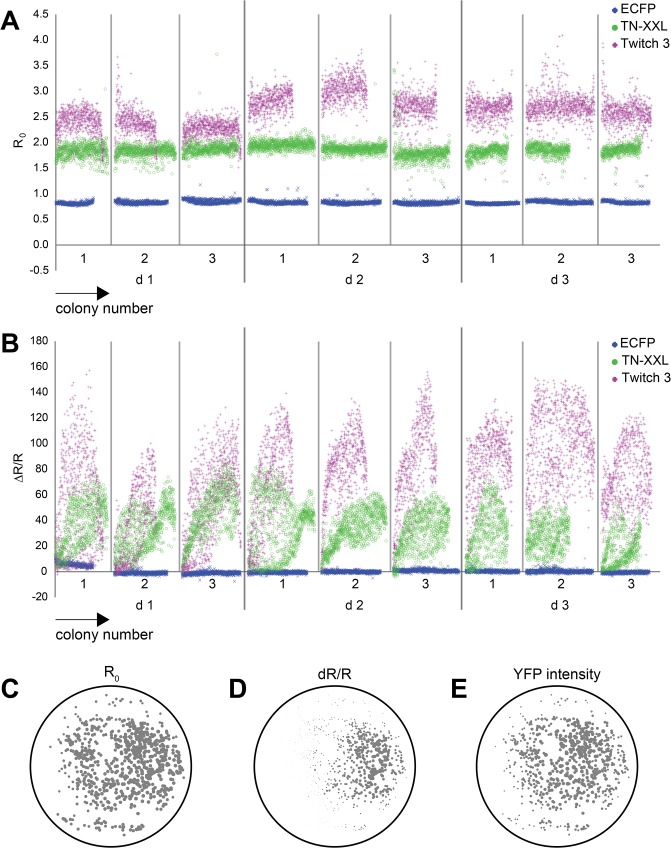
Fig 5. Analysis of variability.
(A) Basal ratio R0 of all colonies on a plate expressing either ECFP or the FRET sensors TN-XXL and Twitch-3, ordered according to their position on the plate from bottom right to top left. 3 individual measurements were performed per day (1–3) on 3 different days after plating (d1-d3). (B) ΔR/R of the same colonies as shown in (A) after pretreatment with poly-L-lysine and ionomycin and application of calcium. (C-E) Bubble plot scheme showing dependency of a colony’s R0, ΔR/R and YFP intensity on the position on the blotted paper. Colonies express Twitch-3. Positions of colonies on a blotted paper are indicated by a circle at the corresponding position. The diameter of the circle indicates the relative value for R0, ΔR/R and YFP intensity. Note that basal ratio R0 is relatively independent of position, while the ΔR/R value shows a high degree of variability between colonies.

