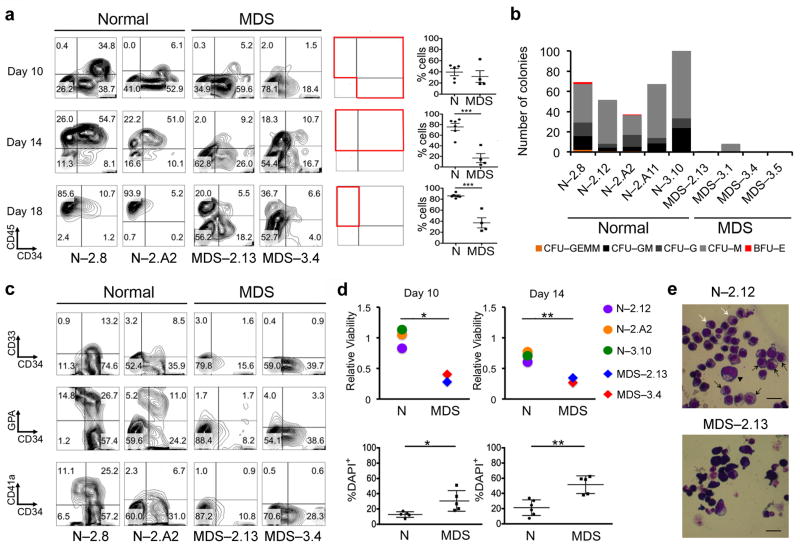
Figure 2. MDS-iPSCs have diminished hematopoietic differentiation potential.
(a) Left panels: CD34 and CD45 expression at days 10, 14 and 18 of hematopoietic differentiation in representative normal and del(7q)-MDS-iPSC lines. Right panels: CD34 and CD45 expression and co-expression at days 10, 14 and 18 of hematopoietic differentiation, as indicated, in all iPSC lines tested. Each graph shows the percentage of cells within the quadrants included in the corresponding red box. Mean and SEM are shown. Each line was tested in 1–4 independent differentiation experiments. For those lines that were differentiated more than once, the mean value is shown. ***P<0.001.
(b) Hematopoietic colony assays in methylcellulose at day 14 of hematopoietic differentiation. The number of colonies from 5,000 seeded cells is shown. (CFU-GEMM: colony-forming unit-granulocyte, erythrocyte, monocyte, megakaryocyte; CFU-GM: colony-forming unit-granulocyte, monocyte; CFU-G: colony-forming unit-granulocyte; CFU-M: colony-forming unit-monocyte; BFU-E: burst-forming unit-erythrocyte)
(c) Assessment of lineage markers CD33 (myeloid), GPA (Glycophorin A) or CD235 (erythroid) and CD41a (megakaryocytic) at day 10 of hematopoietic differentiation.
(d) Cell viability measured by a luminescence assay based on ATP quantitation (upper panels) and by DAPI staining (lower panels) on days 10 and 14 of hematopoietic differentiation, as indicated. Viability in the upper panels is given relative to viability on day 1 of hematopoietic differentiation. Mean and SEM are shown. Each line was tested in 1–4 independent differentiation experiments. For those lines that were differentiated more than once, the mean value is shown. *P<0.05, **P<0.01.
(e) May-Giemsa staining of cells cultured for an additional 12 days in erythroid differentiation media. In normal cells we can morphologically identify cells at several stages of maturation from proerythroblast (arrowhead) to basophilic, polychromatophilic (black arrows) and orthochromatic (white arrows) erythroblasts. No morphological changes of progression to maturation are seen in MDS cells. Scale bars, 10 μm.

