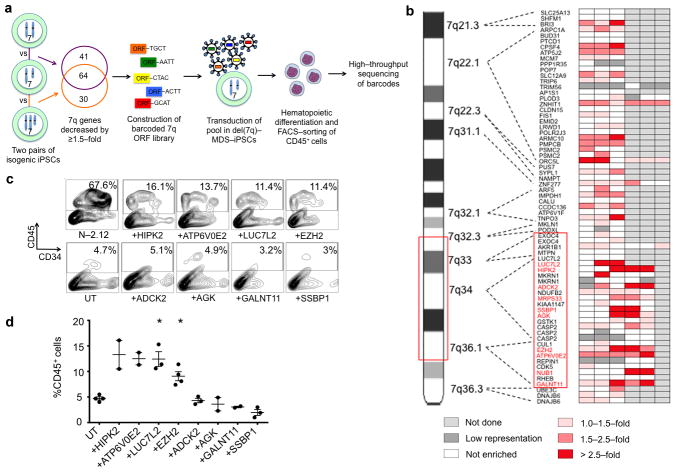
Figure 5. A phenotype-rescue screen identifies candidate haploinsufficient genes in del(7q)-MDS.
(a) Scheme of genetic screen. Expression microarray analyses of two isogenic pairs of iPSCs with one or two copies of chr7q were used to select candidate haploinsufficient genes, which were then each tagged to a unique barcode and cloned to construct a lentiviral ORF library. The library was transduced as a pool into del(7q)-MDS-iPSCs and genes that rescued hematopoiesis were identified by means of enrichment in sorted CD45+ progenitors differentiated from the cells.
(b) Heat map of gene enrichment from 3–6 independent experiments. Fold enrichment was calculated from the sequencing reads as %representation in CD45+ cells over % representation in undifferentiated cells. Values between 0–1.0 are depicted as “not enriched”. Barcodes with read counts lower than 100 (marked as “low representation”) were not included in the analysis. Genes within the critical region (red box) that were recurrent (i.e. in at least 2 independent experiments) hits (i.e. had enrichment >1.5-fold) are shown in red. See also Supplementary Table 11.
(c) Day 14 of hematopoietic differentiation of a del(7q)-iPSC line (MDS-2.12-D-8Cre23) transduced with lentiviral vectors expressing HIPK2, ATP6V0E2, LUC7L2, EZH2, ADCK2, AGK, GALNT11 or SSBP1, as indicated, compared to the untransduced (UT) line. One representative experiment is shown for each condition.
(d) CD45 expression at day 14 of hematopoietic differentiation of the groups shown in (c). Mean and SEM are shown. *P<0.05.

