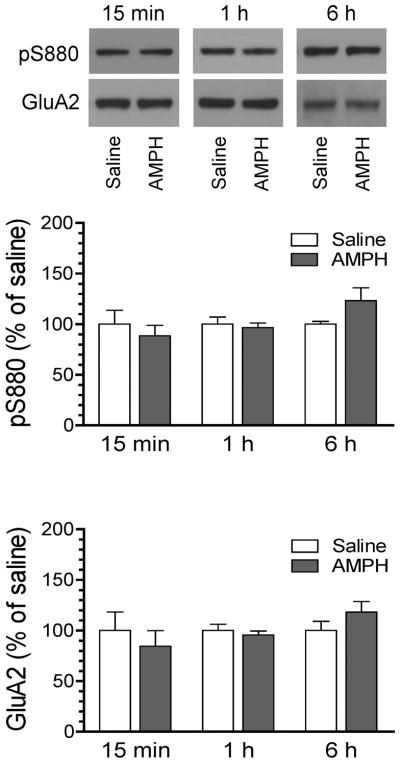
Figure 4. Time course analysis of effects of AMPH on GluA2 S880 phosphorylation in the rat hippocampus.

Representative immunoblots are shown above the quantified data. Rats were treated with a single i.p. injection of saline or AMPH (5 mg/kg) and were sacrificed at different time points (15 min, 1 h, or 6 h after drug injection) for preparing synaptosomal proteins for immunoblot analysis. Data are presented as means ± SEM (n = 4–6 per group).
