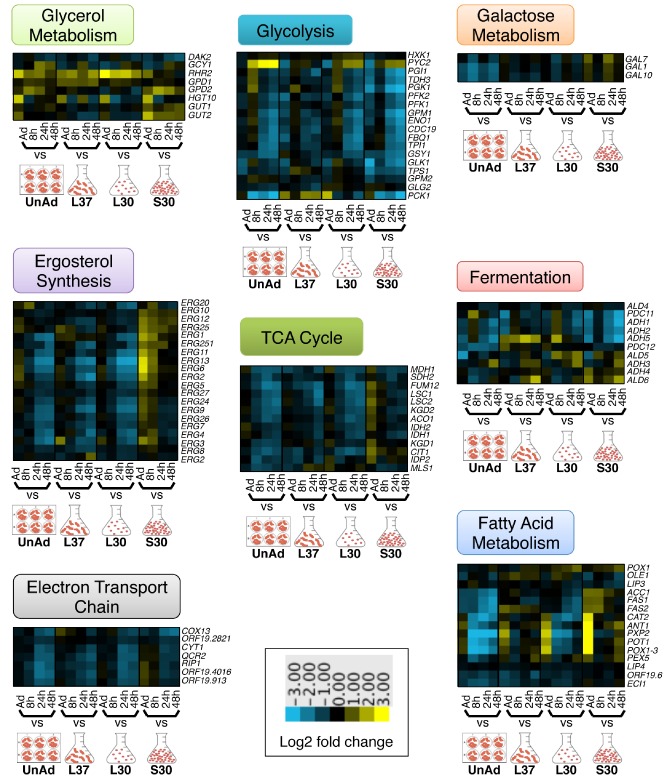
Figure 3.

Metabolism is downregulated over time during biofilm development. Heat maps of gene expression in C . albicans in biofilms at the indicated time points, compared with each of four reference conditions: unadhered cells (UnAd), log phase cells grown at 37°C (L37), log phase cells grown at 30°C (L30) and stationary phase cells grown at 30°C (S30). Shown are the median values of at least two biological replicates. Each heat map shows expression of genes involved in the metabolic processes of glycolysis, the tricarboxylic acid cycle (TCA) cycle, the electron transport chain, fermentation, glycerol metabolism, galactose metabolism, fatty acid metabolism or ergosterol biosynthesis. Upregulated genes are yellow; downregulated genes are blue.
