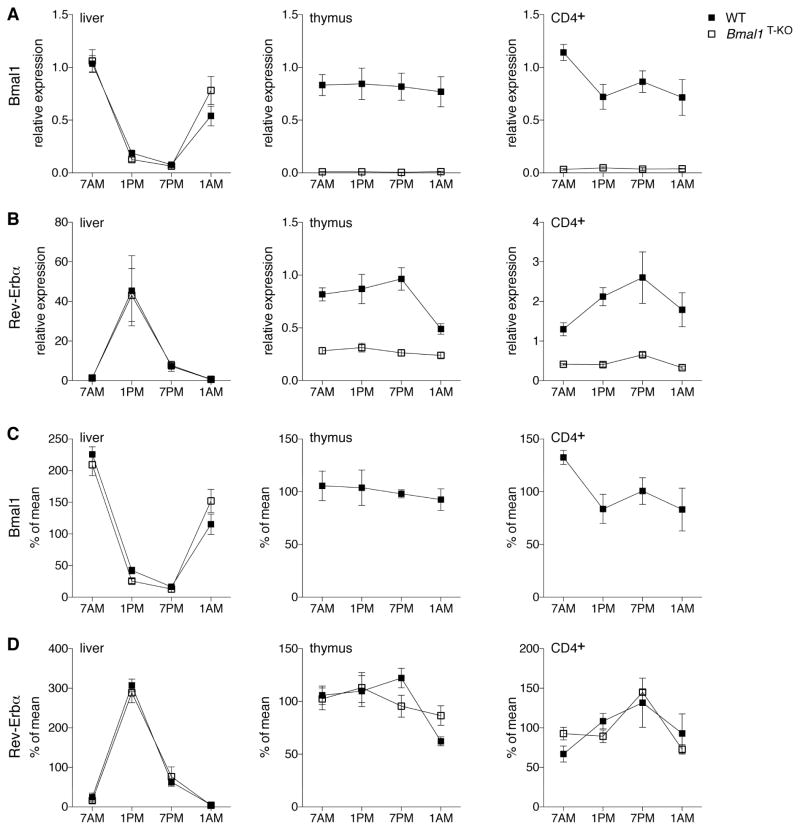
Figure 3. Circadian Oscillation of the Molecular Clock in T Cells is Minor Compared to Liver.
Liver (left panel), thymus (middle panel) and CD4+ splenocytes (right panel) were harvested from control and Bmal1T-KO mice at the indicated time-points. RNA was processed, reverse transcribed and analyzed by quantitative PCR. Expression (2−ddCt) of Bmal1 (A) and Rev-Erbα (B) is shown relative to the WT 7AM time-point. Expression of Rev-Erbα is significantly lower in thymus and CD4+ splenocytes at all time-points analyzed. To visualize oscillation of the transcripts independent of gene expression, the data from (A) and (B) was calculated as % of mean for each individual mouse and time-point for Bmal1 (C) and Rev-Erbα (D). Data are comprised from 3–6 mice per group. Error bars represent mean ± SEM. See also Figure S4.

