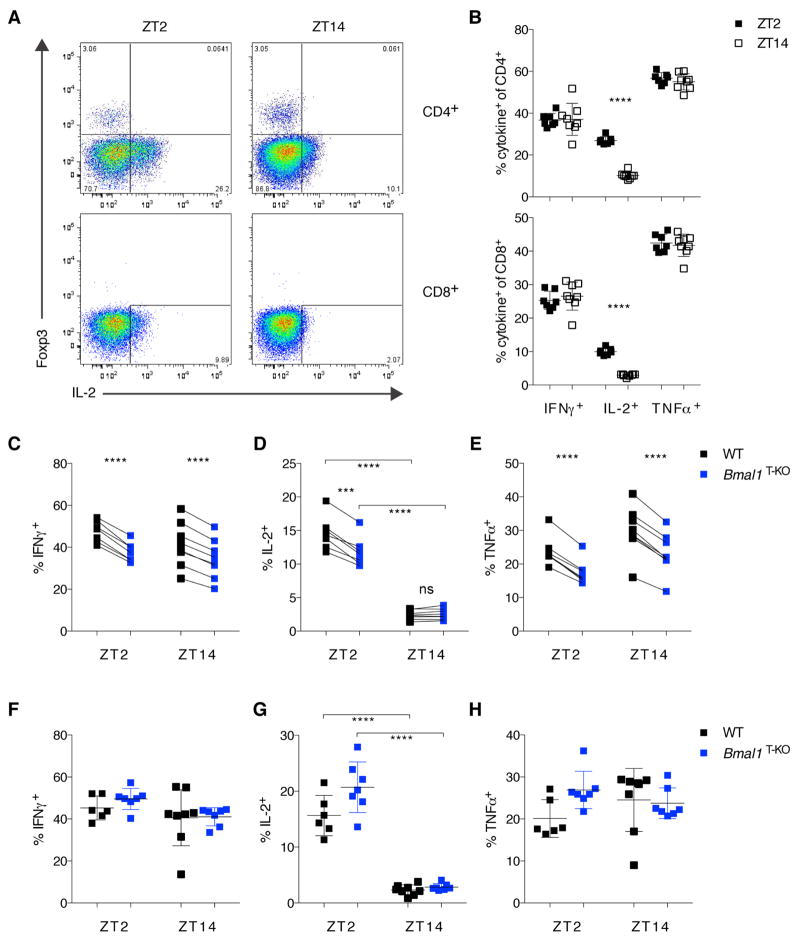
Figure 5. L. monocytogenes-Elicited IL-2 Production is Sensitive to Circadian Time of Infection but Independent of Bmal1 Expression in T Cells.
(A) Representative FACS plots of IL-2 production by CD4+ (upper panels) and CD8+ T cells (lower panels) at d7 post Lm-OVA infection at ZT2 versus ZT14.
(B) Summary of data from (A). Cytokine response was measured after αCD3/αCD28 stimulation ex vivo. (Upper panel: CD4+ T cells; lower panel: CD8+ T cells).
(C–D) Paired analysis of co-transferred WT (black squares) or Bmal1T-KO OTI cells (blue squares) at d7 post Lm-OVA infection after re-stimulation with OVA-peptide. (C, E) Paired comparison of co-transferred cells showed significant differences in IFNγ and TNFα production (paired t-test). (D) Pairwise comparison revealed significant differences in IL-2-production at ZT2 (paired t-test), as well as significant differences in IL-2 production at ZT2 versus ZT14 (unpaired t-test).
(F–H) Single-transfer of WT or Bmal1T-KO OTI cells were analyzed at d7 post Lm-OVA infection for IFNγ (F), IL-2 (G), and TNFα production (H). IL-2 production was significantly different at ZT2 versus ZT14 (unpaired t-test).
(B–H) Error bars represent mean ± SD. All data are representative of at least two individual experiments. ***p<0.001, ****p<0.0001. See also Figures S6–7.

