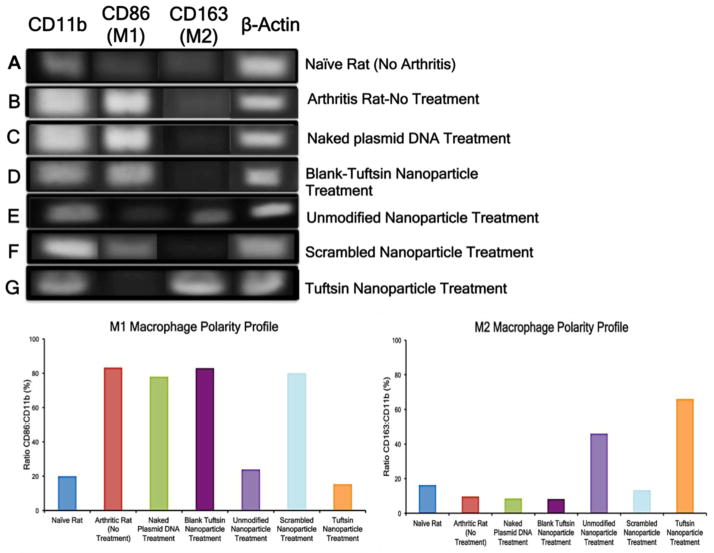
Figure 4. Synovial macrophage polarity profile for various control and targeted nanoparticle treatments containing murine IL-10 plasmid DNA evaluated via RT-PCR analysis.
Top Panel represents the agarose gel image of the PCR products for CD11b, CD86, CD163 and β-actin. The PCR product sizes are 146 bp, 99bp, 98bp, and 119 bp, respectively. β-Actin served as an internal control. Bottom Panel represents the ratio of the CD86: CD11b and CD163:CD11b to semi-quantitatively analyze the M1 and M2 percentage of total macrophages (positive for CD11b), respectively. The band intensity was calculated via NIH ImageJ software. The data is representative of macrophage population that was obtained by pooling together cells collected from hind paws of five animals per treatment group.

