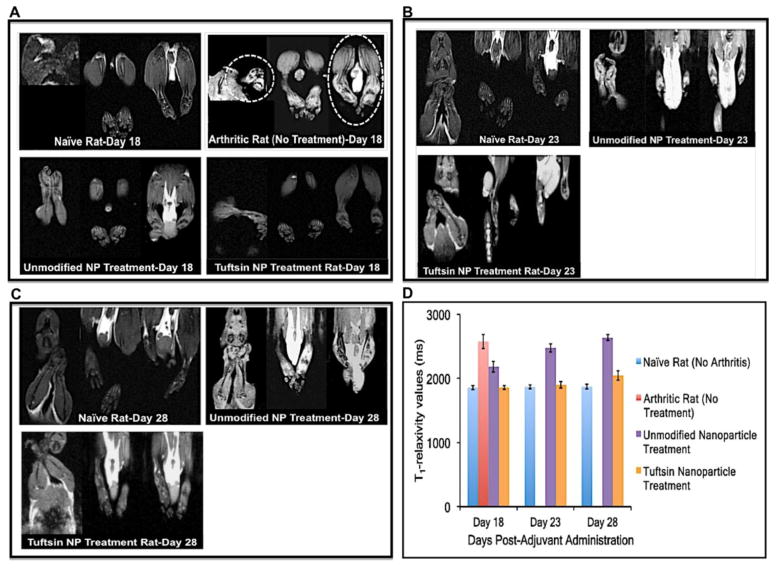
Figure 6. T1-weighted magnetic resonance imaging showing the presence of edema.
The scans were performed at days 18 (A), 23 (B), and 28 (C) post-adjuvant administration. Absence of bright contrast in paw scans of naïve rats (no disease) indicated no edema in the paws. At day 18, paw scans of arthritis-bearing animals (no treatment) showed bright contrast in both fore/hind paws (highlighted by dotted circles), which is indicative of marked edema or fluid accumulation. Similar pattern was observed for IL-10 plasmid DNA containing unmodified nanoparticles at days 23 and 28. Tuftsin-peptide modified nanoparticles containing IL-10 plasmid DNA showed pattern very similar to naïve rats till day 23. From day 28 onwards, edema was evident in the upper extremities of rats paws treated with tuftsin nanoparticles. (D) Quantitative analysis of the edema profile was performed by calculating the T1 relaxivity measurements in milliseconds using MIVA and ITKSNAP software. These value represent the water proton spin relaxation times in the biological tissue. T1 value calculated for joint samples in case of naïve rats (no arthritis) was found to be ~1850 ms. In the case of arthritic-bearing rats (no treatment), these values were relatively higher indicating more water content or edema in paws of these animals. The cumulative values for fore and hind paws were reported as Mean+/−Std. Dev (n=3 rats/group). NP = nanoparticle formulation.

