
Fig. 4.
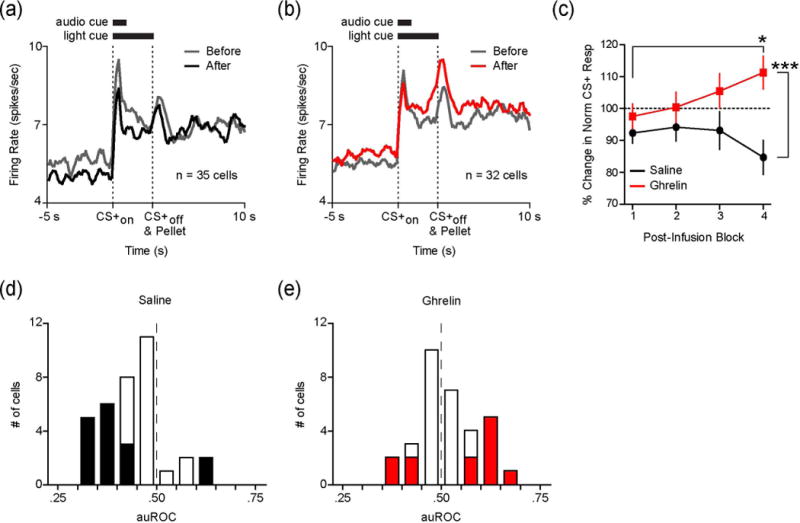
LV ghrelin increases CS+ evoked activity in NAc neurons. (a) Average firing rate of CS+ responsive cells during the 5 s before to 10 s after CS+ onset before (gray) and after (black) LV infusion of saline (n=35 neurons; 20 trials per neuron per block). (b) Average firing rate of CS+ responsive cells during the 5 s before to 10 s after CS+ onset before (gray) and after (red) LV infusion of ghrelin (n=32 neurons; 20 trials per neuron per block). (c) Average % change in normalized firing rate during the 3 s CS+ following LV saline (black) or ghrelin (red) in 5 trial blocks. Pre-infusion firing rate is indicated by the dashed line at 100%. (d) Population density histogram of differences in firing rate (plotted as auROC values) during the 3 s CS+ comparing the second block of 10 trials after LV saline to pre-infusion firing rate (auROC<0.5, after<before; 0.5, no difference; auROC>0.5, after>before). Cells with significant auROC values are filled black (p<.05). E, Population density histogram of auROC values during the 3 s CS+ comparing the second block of 10 trials after LV ghrelin to pre-infusion firing rate (auROC<0.5, after<before; auROC>0.5, after>before). Cells with significant auROC values are filled red (p<.05). *p<.05 for ghrelin block 1 compared to block 4, ***p<.001 for ghrelin block 4 compared to saline block 4.