
Figure 2.
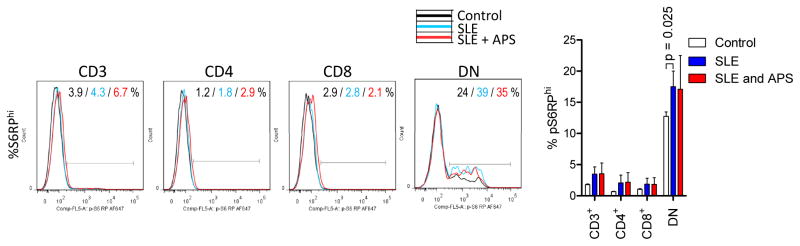
Comparable mTOR pathway activity in lupus T cells of patients with or without APS. mTORC1 activity was measured by the frequency of cells with elevated intracellular phosphorylated S6 ribosomal protein levels (%pS6RPhi). Left panels show representative histogram overlays, while bar chart depicts the mean ± SEM of fold changes relative to paired controls normalized at 1.0. p values reflect comparison between SLE patients with and without APS using unpaired t-test.