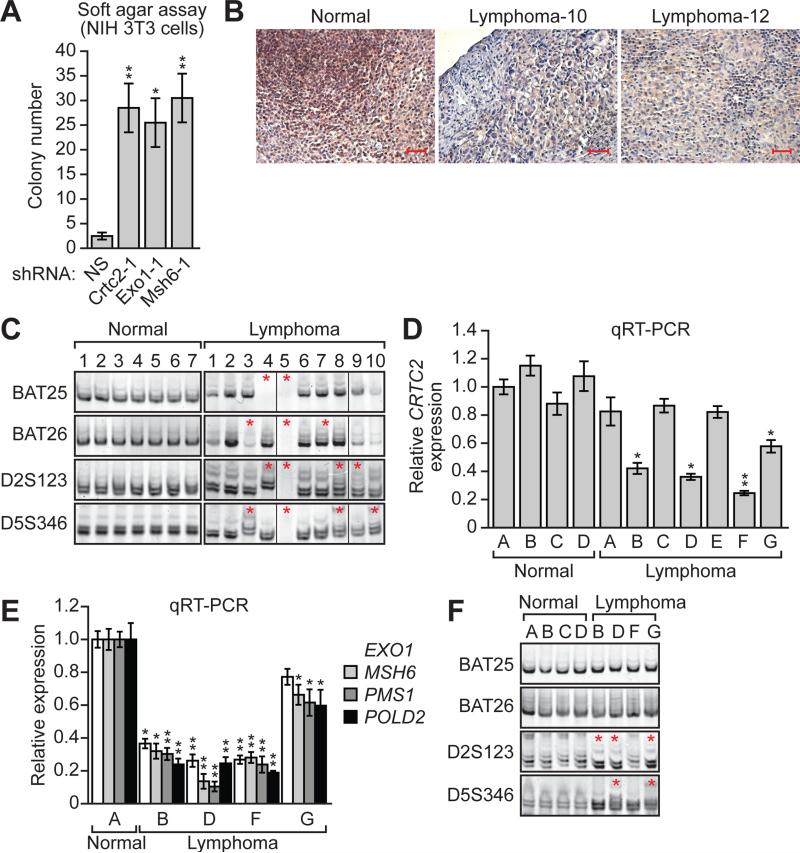
Figure 3. Decreased Expression of CRTC2 in Specific Lymphoma Subtypes.
(A) Soft agar assay. NIH 3T3 cells stably expressing a NS, Crtc2, Exo1 or Msh6 shRNA were analyzed for colony formation, which was normalized to that obtained in cells expressing NS shRNA, which was set to 1.
(B) Representative examples of immunohistochemistry for CRTC2 in normal (tonsil) and two independent lymphoma tissue samples. Scale bars, 100 μM.
(C) MSI analysis at BAT25, BAT26, D2A123 and D5S346 in normal and in lymphoma samples. Non-adjacent lanes from the same gel were spliced together as indicated by the dividing lines.
(D) qRT-PCR monitoring CRTC2 expression in normal and lymphoma samples.
(E) qRT-PCR analysis monitoring expression of EXO1, MSH6, PMS1 and POLD2 in normal and lymphoma samples with loss of CRTC2 expression. For all graphs, error bars indicate SD. *P<0.05, **P<0.01.
(F) MSI analysis at BAT25, BAT26, D2A123 and D5S346 in normal and lymphoma samples with loss of CRTC2 expression.
See also Figure S4.

