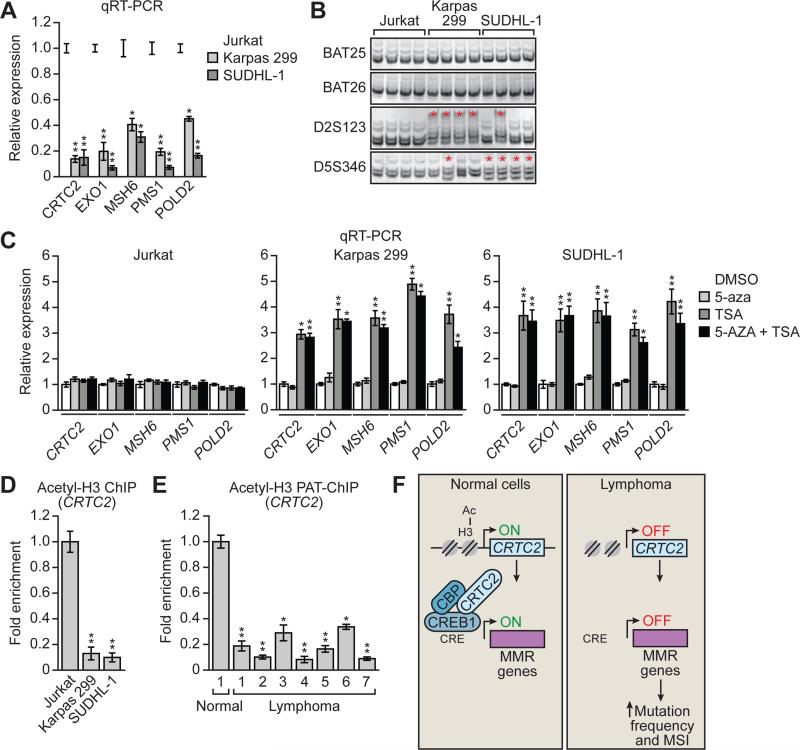
Figure 4. Reduced CRTC2 Expression in Lymphoma Cell Lines and Patient Samples Due to Decreased Acetylation of Histone H3.
(A) qRT-PCR analysis monitoring expression of CRTC2, EXO1, MSH6, PMS1 and POLD2 in Jurkat, Karpas 299 and SUDHL-1 cells.
(B) MSI analysis at BAT25, BAT26, D2A123 and D5S346 in Jurkat, Karpas 299 and SUDHL-1 cells.
(C) qRT-PCR analysis monitoring expression of CRTC2, EXO1, MSH6, PMS1 and POLD2 in Jurkat, Karpas 299 and SUDHL-1 cells treated with 5-aza, TSA or both.
(D) ChIP analysis monitoring histone H3 acetylation (acetyl-H3) levels on the CRTC2 promoter in Jurkat, Karpas 299 and SUDHL-1 cells.
(E) PAT-ChIP assay monitoring acetyl-H3 levels of the CRTC2 promoter in normal and lymphoma samples. For all graphs, error bars indicate SD. *P<0.05, **P<0.01.
(F) Schematic model.

