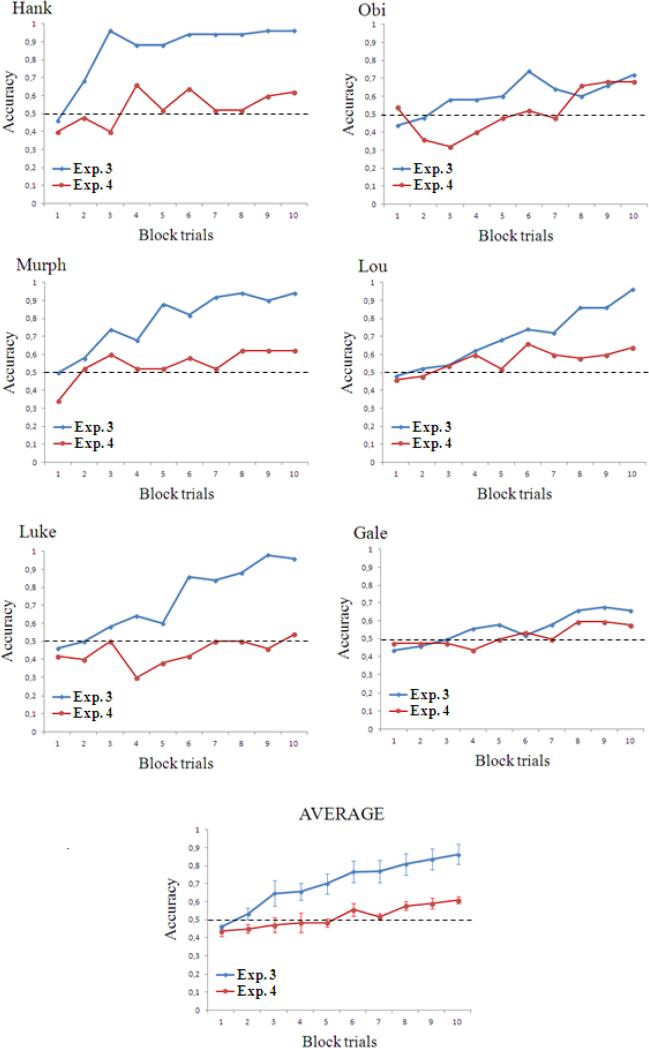
Figure 6. Learning curves of Experiment 3 (trials 1-500) and Experiment 4.
The data from each monkey are presented as successive blocks of 50 trials. Monkeys’ learning rates statistically differed in the two experiments, with subjects being quicker in the discrimination task of Experiment 3. The dashed lines represent chance level. Bars represent the standard error of the mean.

