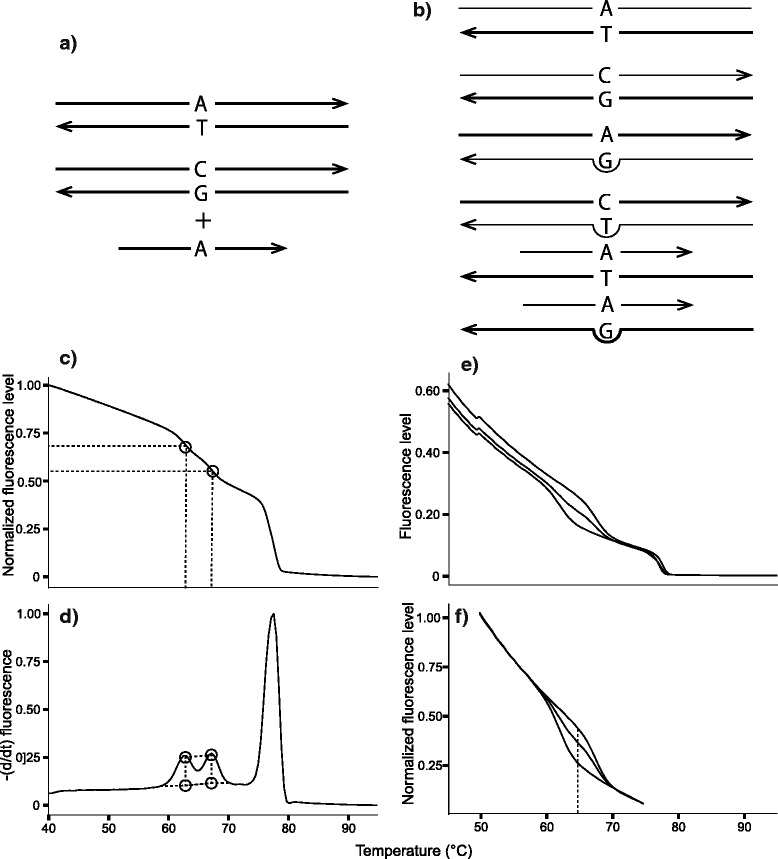
Fig. 2.

Schematic diagram of qHRM. An individual heterozygous for a particular SNP locus is shown as an example. a For both methods, the locus is amplified from genomic DNA using asymmetric PCR to generate an excess of the reverse strand. Next, an oligonucleotide probe is added to the reaction. b The mixture is heated to melt all duplexes apart, and subsequently cooled rapidly to promote unbiased duplex reformation of all possible duplex DNA species. For a biallelic SNP site, this produces six distinct types of duplexes: two perfect-match amplicon duplexes, two mismatch amplicon duplexes, one perfect-match probe duplex, and one mismatch probe duplex. c For the peaks method, the reaction is heated again to denature all duplexes while the fluorescence of the reaction, which quantifies double stranded DNA, is monitored. d Next, the negative first derivative of the decreasing fluorescence curve is calculated to transform the curve into a peaks profile. The height of the lowest-melting, mismatched probe duplex peak is divided by the total heights of both probe peaks to yield the frequency of the mismatched allele in the sample. e For the curves method, the same process was repeated as described for panel c. Three known samples that consist of each genotype (i.e. heterozygote, high-melting homozygote and low-melting homozygote) were used as references. f Melt curves from the raw channel were normalized by averaging fluorescence value outside a melting phase and forcing the values to be the same for each sample
