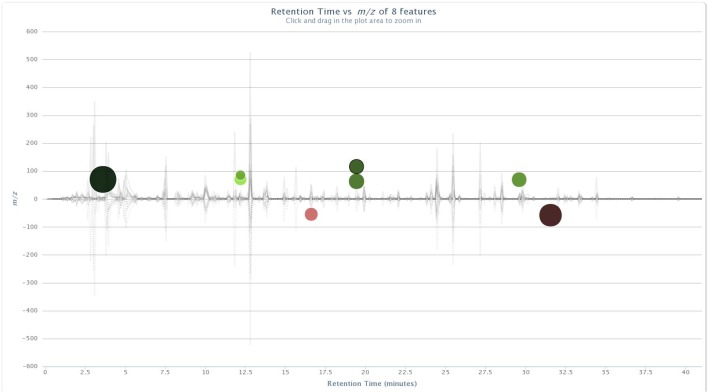
Fig 1. Cloud plot of aligned GC/MS chromatograms generated with XCMS Online for non-vaccinated male WTD pre-challenge vs. five months post-M. bovis strain 95–1315 challenge.
Pre-challenge fecal sample chromatograms are depicted below the X-axis. Post- challenge chromatograms are positioned above. Up-regulated features of statistical significance are identified with green-colored circles located at the top of the plot, and down-regulated features are identified by red-colored circles located at the bottom of the plot. The color intensity of each circle represents the statistical significance of the feature difference, with brighter circles having lower p-values. The diameter of each circle represents a log-fold increase or decrease in abundance (i.e., larger circles correspond to peaks with greater fold differences). doi: http://dx.doi.org/10.6084/m9.figshare.141831.

