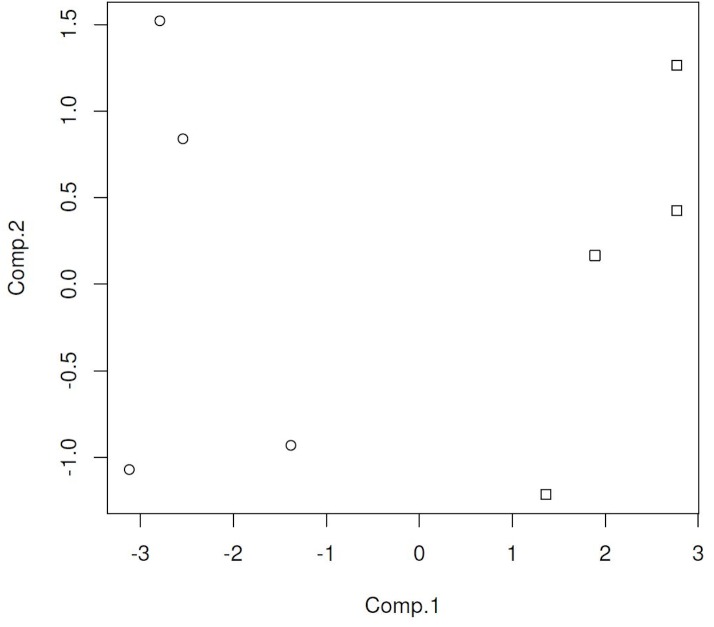
Fig 5. PCA score plot for non-vaccinated WTD fecal sample cluster analysis.
On the X-axis are the 1st component scores, the on the Y-axis are the 2nd component scores. Squares represent pre-challenge samples, circles represent post-challenge samples at 5 months. doi: http://dx.doi.org/10.6084/m9.figshare.141831.

